










Anthem Biosciences Limited Q2 FY27 EBITDA Margin Reaches 50.6%
Key highlights
- Anthem Biosciences reported Q2 FY27 revenue from operations of ₹594.0 crore, up 7.9% year on year.
- Q2 FY27 EBITDA rose 24.1% year on year to ₹330.4 crore, while EBITDA margin reached 50.6%.
- Q2 FY27 profit after tax increased 21.9% year on year to ₹211.5 crore, with PAT margin at 32.4%.
- Anthem Biosciences reported net cash of ₹1,538.0 crore as of September 30, 2026.
powered by IRIS
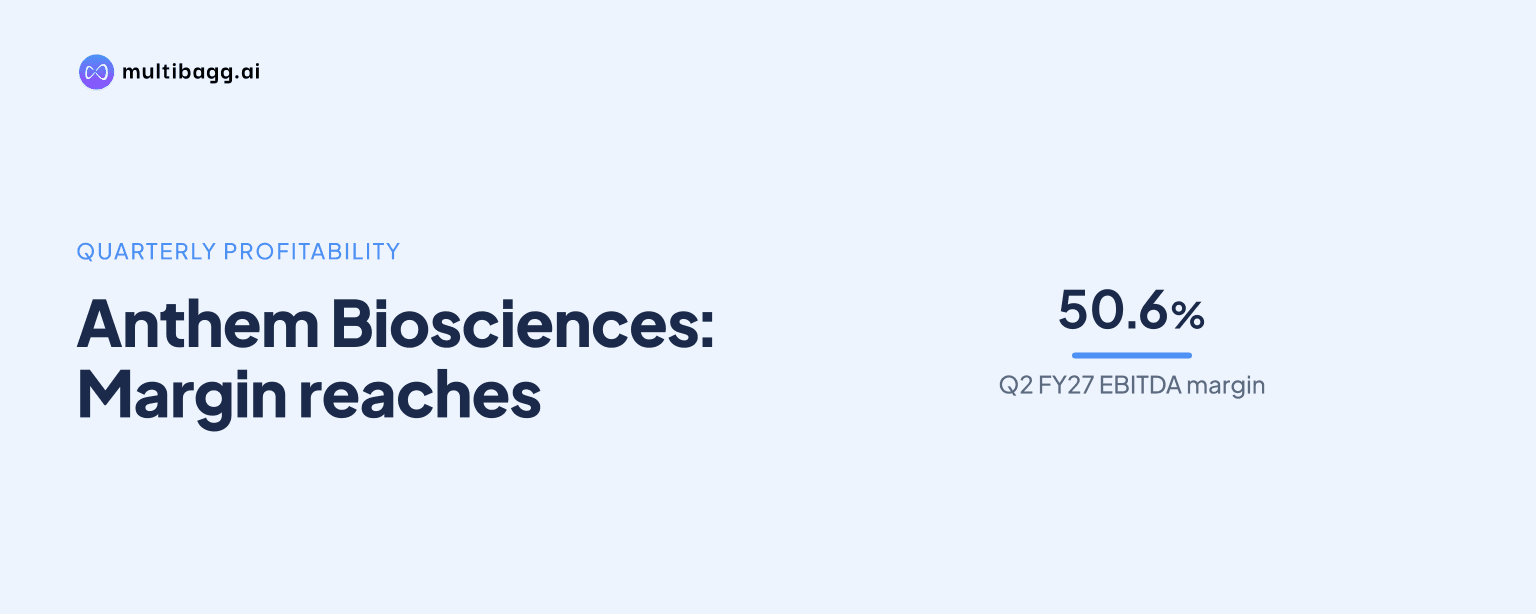
Anthem Biosciences Limited reported a record 50.6% EBITDA margin in Q2 FY27, while revenue from operations rose 7.9% year on year to ₹594.0 crore and EBITDA increased 24.1% to ₹330.4 crore. The September-quarter performance matters because profit growth outpaced sales growth despite lower first-half revenue year on year.
Know Anthem Biosciences inside out
Results, valuation, peers and who's buying, in one view.
What did Anthem Biosciences report for Q2 FY27?
Anthem Biosciences reported consolidated revenue from operations of ₹594.0 crore for Q2 FY27, compared with ₹550.5 crore in Q2 FY26. The 7.9% year-on-year increase was accompanied by total revenue, including other income, of ₹652.9 crore, up 9.1% from ₹598.3 crore a year earlier.
The company reported EBITDA of ₹330.4 crore, compared with ₹266.1 crore in the corresponding quarter of FY26. Profit after tax was ₹211.5 crore, against ₹173.4 crore in the prior-year period. These figures are drawn from Anthem Biosciences' Q2 FY27 investor presentation and interim-report information for the quarter ended September 30, 2026.
The presentation was published on November 3, 2026. Anthem Biosciences had not published an earnings-call transcript for the quarter when the presentation details were released, so the reported figures represent presentation disclosures rather than additional management guidance.
How did Anthem Biosciences' revenue and profit margins change?
Anthem Biosciences expanded its EBITDA margin by 610 basis points year on year to 50.6% in Q2 FY27 from 44.5% in Q2 FY26. PAT margin rose to 32.4% from 29.0%, indicating that earnings grew faster than total revenue during the quarter.
The difference between revenue and EBITDA growth is significant. Revenue from operations increased 7.9%, while EBITDA increased 24.1% and PAT rose 21.9%. The investor presentation attributed the quarterly acceleration to CRDMO growth. CRDMO remained the larger segment in the half-year disclosure, although the supplied information does not provide segment-level revenue or profitability figures.
What was the role of CRDMO in the quarterly performance?
CRDMO growth was identified by Anthem Biosciences as the driver of the Q2 FY27 revenue and margin acceleration. The company described the quarter as being led by its CRDMO business, which was also stated to be its larger segment during the first half of FY27.
CRDMO, or contract research, development and manufacturing operations, is material to how investors assess the business because it combines multiple stages of pharmaceutical development and manufacturing work. However, the information supplied with the presentation does not disclose customer additions, order values, product programmes, capacity utilisation or segment-specific margins. The available data therefore supports the company’s stated contribution of CRDMO to quarterly performance but does not quantify that contribution.
The presentation also reported that H1 FY27 revenue declined year on year, even as half-year EBITDA and PAT increased. This makes the September quarter important within the half-year period: it delivered year-on-year growth in revenue from operations while preserving stronger profitability metrics. No absolute H1 revenue, EBITDA or PAT figure was included in the supplied information.
Got a follow-up? Ask IRIS
What do the results mean for investors and operations?
For investors, the main reported change was the increase in operating and net profit margins. A 50.6% EBITDA margin and 32.4% PAT margin mean that the company retained a larger share of total revenue as EBITDA and post-tax profit than it did in Q2 FY26.
Anthem Biosciences also reported net cash of ₹1,538.0 crore as of September 30, 2026. Net cash is a relevant balance-sheet indicator because it shows the company had cash exceeding borrowings at that date, based on the presentation's stated measure. The supplied material does not provide a comparable prior-period net-cash figure, debt maturity profile or cash-flow details.
The available disclosures do not provide a capex amount, a capacity-expansion budget, or a timetable for new facilities. As a result, the Q2 presentation data supports an assessment of revenue and margin performance, but it does not allow a quantified conclusion on near-term capital spending or the operational return expected from any future expansion.
What should the market watch after the Q2 FY27 update?
The next disclosed event is Anthem Biosciences' earnings conference call scheduled for November 4, 2026, at 12:30 PM IST. The company said the call would discuss unaudited standalone and consolidated financial results for the quarter and half-year ended September 30, 2026.
The call may provide context on the reported CRDMO-led growth, the lower H1 revenue comparison, margins and capital allocation. Until management commentary or a transcript is available, the investor presentation remains the stated source for the quarterly operating metrics. The supplied information does not establish a share-price reaction attributable to the results.
Conclusion
Anthem Biosciences delivered higher Q2 FY27 revenue, EBITDA and PAT than in Q2 FY26, with EBITDA margin reaching 50.6% and PAT margin increasing to 32.4%. The reported results show quarterly profit growth exceeding revenue growth, while the company identified CRDMO as the main operational driver.
Investors should watch the November 4 earnings call for management commentary on CRDMO, the year-on-year decline in H1 revenue, and any detail on capital expenditure. The supplied presentation does not disclose a capex figure or forward financial guidance, leaving those matters unresolved in the current update.