



Actions
Action Type



Welcome to Multibagg AI
Log in to access personalized features
IRIS
Multibagg AI is an AI powered stock research and analysis platform. We provide data, information, content, and analytics for publicly traded Indian companies listed on NSE and BSE. AI can make mistakes, check important information.
Research powered by GOALZEN CAPITAL SERVICES PRIVATE LIMITED · SEBI Research Analyst INH000013448
Prices might be delayed by a few minutes.
Join our Exclusive Community


Join our Exclusive Community
Made with 💙 in India. © Finsky Technologies Pvt Ltd. 2026


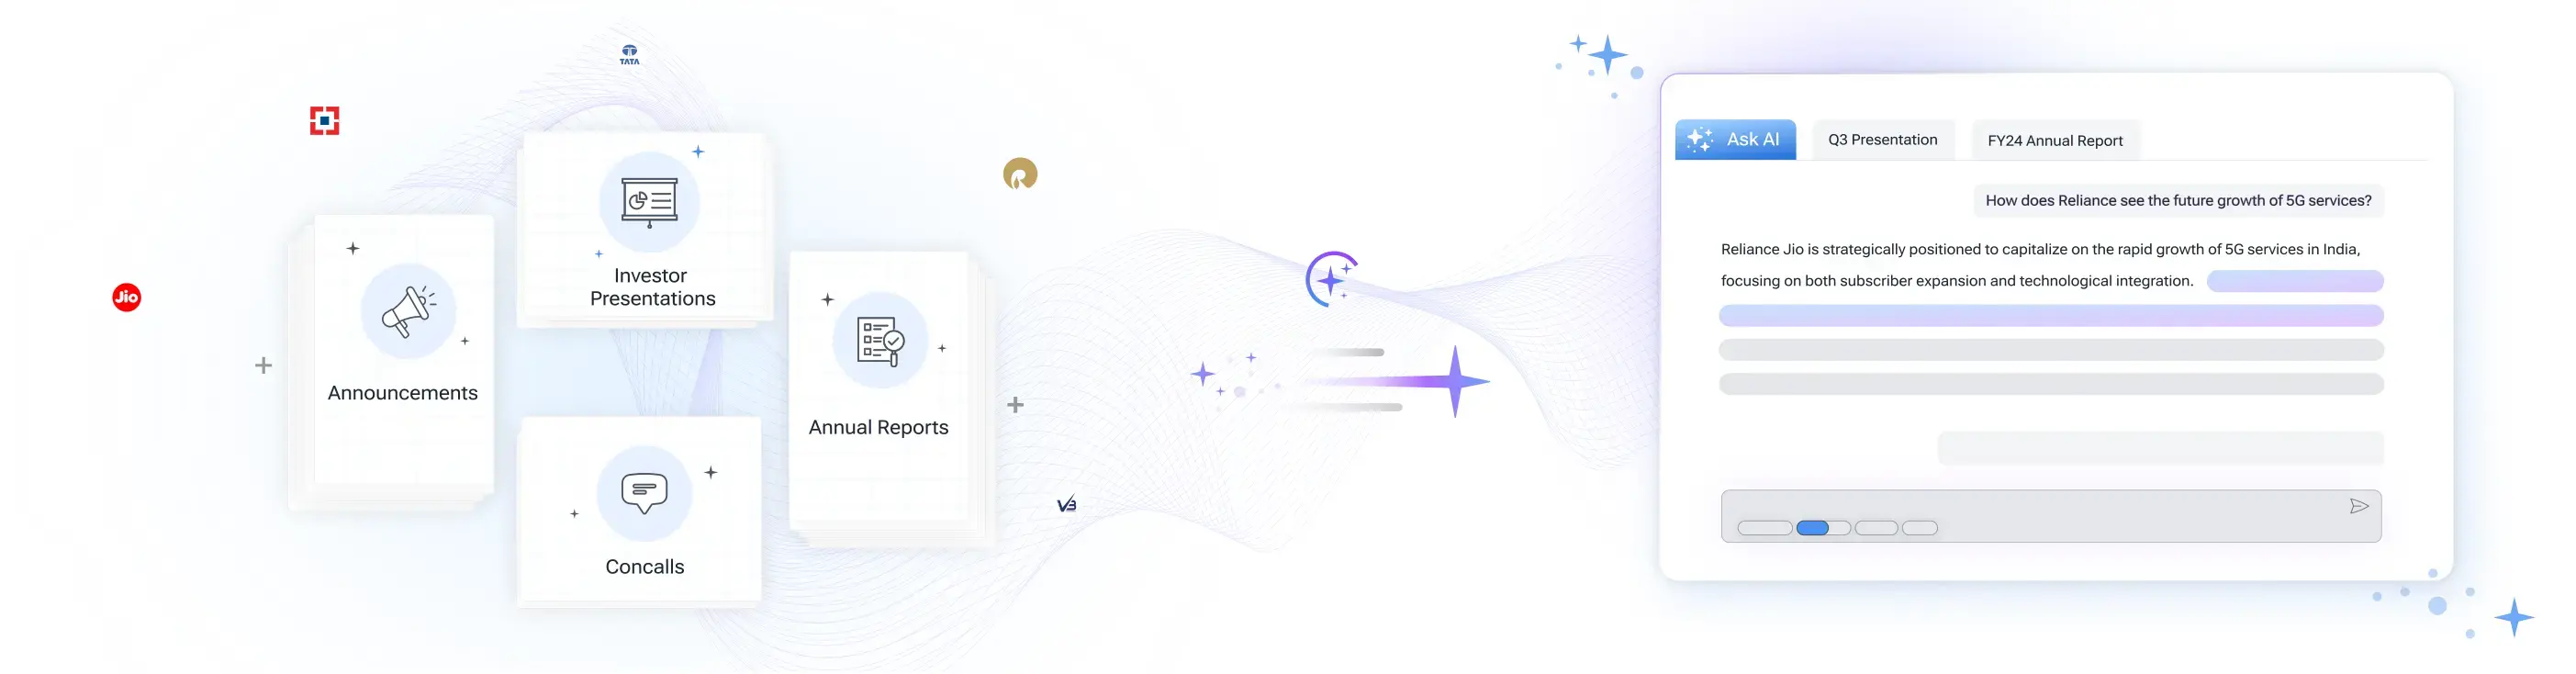
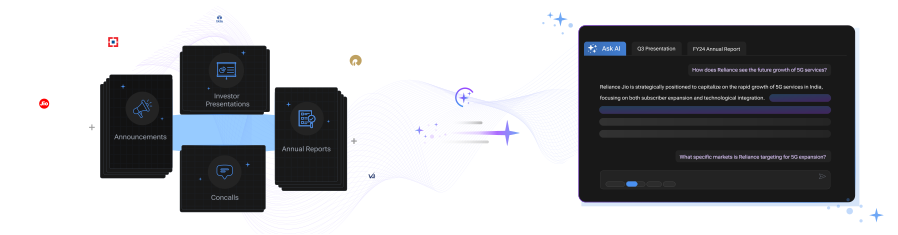
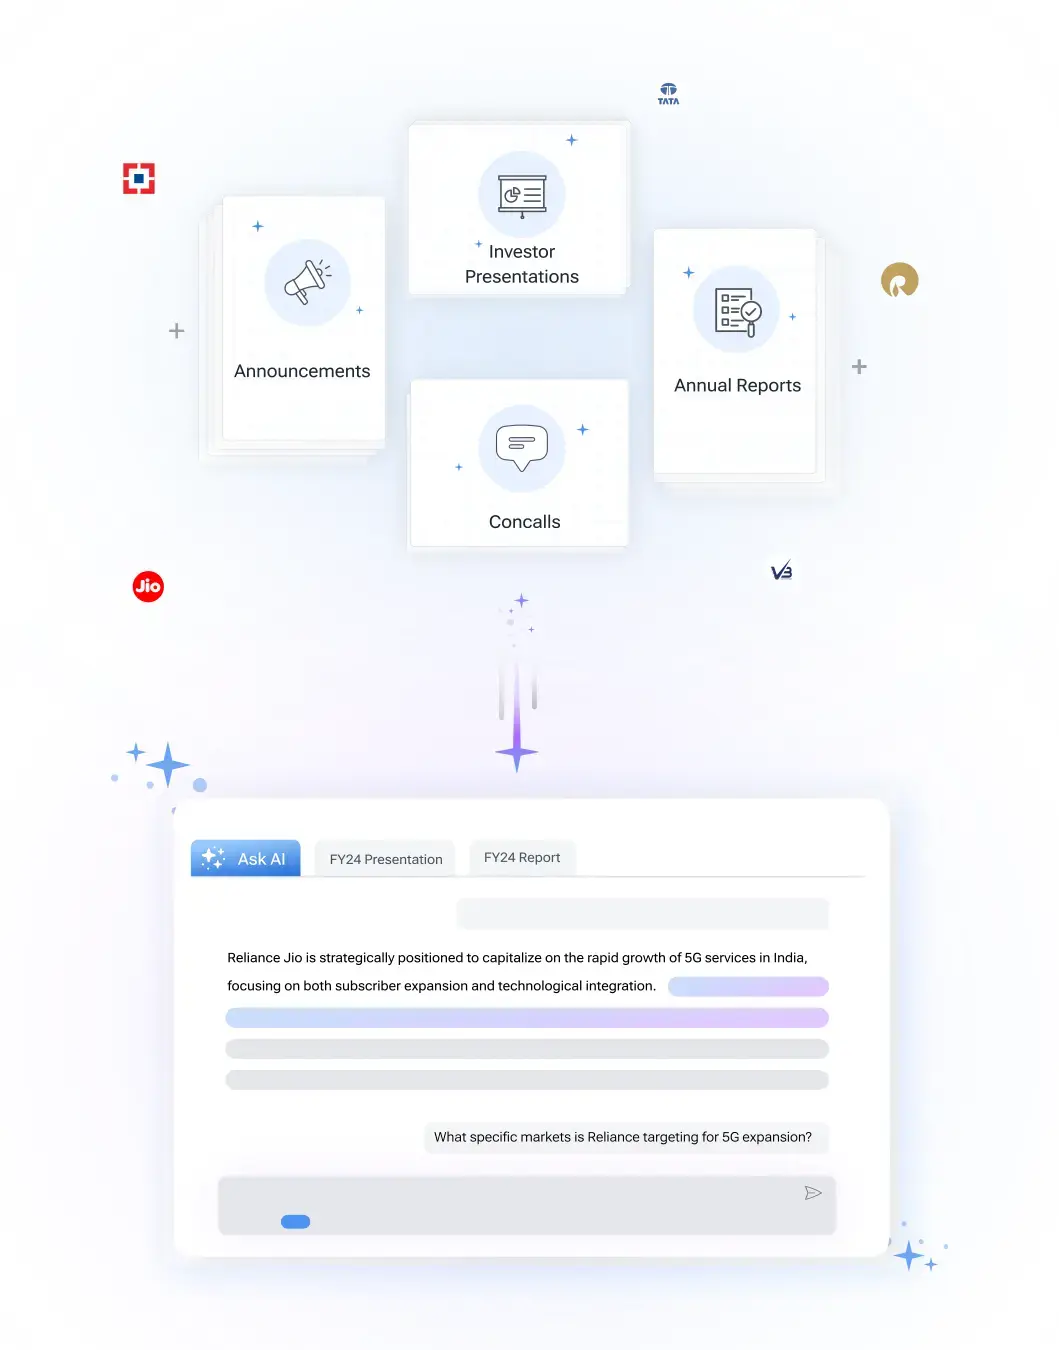
Get instant AI-powered insights about company performance, financials, and strategy. Ask questions about trends, competition, and developments while receiving responses backed by official documents and market data, with clear attribution to source documents.

 Discovery themes featuring this stock
Bearish
1
Neutral
7
Bullish
6
Bearish
2
Neutral
7
Bullish
37
Bearish
1
Neutral
0
Bullish
31
Bearish
1
Neutral
7
Bullish
6
Bearish
1
Neutral
7
Bullish
6
Bearish
1
Neutral
0
Bullish
31
Bearish
1
Neutral
0
Bullish
31
Bearish
1
Neutral
0
Bullish
31
View Standalone
View Standalone
View Standalone
View Standalone
View Standalone
View Standalone
View Standalone
View Standalone



Investor Presentation
Q4 FY26
Investor Presentation
Q4 FY26
Investor Presentation
Q4 FY26
Investor Presentation
Q4 FY26
Investor Presentation
Q4 FY25
Investor Presentation
Q4 FY25
Investor Presentation
Q2 FY25
Investor Presentation
Q1 FY25

Concord Control Systems Ltd (CNCRD) is currently trading at 2,497.00 per share. Stock prices fluctuate during market hours on NSE and BSE based on demand, company updates, and overall market conditions. Refer to the live price chart above for the most recent price movement.
Concord Control Systems Limited manufactures coach- and electrification-related products for Indian Railways while evolving into an integrated railway technology platform combining propulsion, safety, electronics integration and lifecycle services across rolling stock and infrastructure. FY26 was a landmark year: revenue from operations of INR 210.47 crores, PAT of INR 42.7 crores and EBITDA of INR 62.1 crores, supported by an executable order book of ~INR 697 crores (over three times FY26 revenue), giving substantial near-term revenue visibility and scale for accelerated growth. Strategically, Concord is transitioning from product-led sales to a platform model with four pillars—green mobility (battery/hydrogen/hybrid propulsion), smart locomotive intelligence, railway safety (Kavach/MSDAC), and AI-driven diagnostics—aiming to convert one-off equipment sales into annuity, software and service revenues. Fusion Electronics acquisition materially enhances in-house electronics, flex PCB and box-build capabilities with potential to meaningfully increase revenues and reduce import dependence; management expects Fusion to be a revenue contributor in the current year and cites full-scale capacity potential of roughly INR 200 crores. Key execution risks center on working capital cycles and short-term debt volatility due to back-ended railway billing; however, management emphasizes disciplined execution, sovereign customer reliability, and planned conversion of backlog into revenue to support cash flows and margin expansion.
Over the past 52 weeks, Concord Control Systems Ltd has traded between a low of ₹1,645.00 and a high of ₹3,069.85. The 52-week high and low indicate the stock’s price range over the last year and help investors understand its volatility and recent trading levels.
Concord Control Systems Ltd has a market capitalization of approximately 2,554.89. Market capitalization represents the total value of a company’s outstanding shares and helps investors understand its size, stability, and relative risk compared to other listed companies.
Concord Control Systems Ltd’s investment profile depends on its business fundamentals, valuation, and long-term outlook. The stock currently trades at a PE ratio of 62.47 and operates in the its sector sector. Investors typically assess financial performance, growth prospects, and individual risk tolerance before making investment decisions.
Based on its market capitalization of 2,554.89 Cr, Concord Control Systems Ltd is classified as a Small Cap stock. Large-cap stocks are generally more stable, while mid-cap and small-cap stocks tend to offer higher growth potential along with higher price volatility.
Concord Control Systems Ltd operates in the its sector sector. Sector classification matters because companies in the same sector are often affected by similar economic conditions, regulatory changes, and competitive dynamics, which can influence overall stock performance.
The Price-to-Earnings (PE) ratio of Concord Control Systems Ltd is 62.47. The PE ratio compares a company’s share price to its earnings and is commonly used to assess valuation. Comparing the PE ratio with sector peers and historical levels provides better context.
Remote e-voting runs from August 21, 2026 (9:00 am) to September 19, 2026 (5:00 pm).
The board meeting is scheduled for August 17, 2026.
The company announced board restructuring by appointing three independent directors and accepting one resignation, and it approved up to ₹4.65 crore investment in Progota India Private Limited.



| Symbol | Watchlist | Price | Market Cap | P/E | P/B | Div Yield (%) | ROE (%) | ROCE (%) | ROA (%) |
576.70 | 2,781 Cr | 92.12 | 19.34 | 0.10 | 20.05 | 19.48 | 10.63 | ||
1378.85 | 2,762 Cr | 32.61 | 4.00 | 0.87 | 15.98 | 18.48 | 8.72 | ||
383.00 | 2,667 Cr | 65.44 | 4.99 | 0.29 | 9.26 | 11.93 | 2.95 | ||
700.10 | 2,567 Cr | 618.47 | 5.00 | 0.00 | 0.81 | 2.12 | 0.37 | ||
2497.00 | 2,555 Cr | 62.47 | 12.21 | 0.00 | 20.28 | 22.37 | 12.99 | ||
464.45 | 2,503 Cr | 28.44 | 3.34 | 0.63 | 14.71 | 20.32 | 9.84 | ||
226.00 | 2,301 Cr | 24.28 | 3.14 | 0.00 | 12.61 | 17.65 | 6.64 | ||
| Median: 7 Co. | — | 576.70 | 2,567 Cr | 62.47 | 4.99 | 0.10 | 14.71 | 18.48 | 8.72 |


Concord Control Systems Limited manufactures coach- and electrification-related products for Indian Railways while evolving into an integrated railway technology platform combining propulsion, safety, electronics integration and lifecycle services across rolling stock and infrastructure.
FY26 was a landmark year: revenue from operations of INR 210.47 crores, PAT of INR 42.7 crores and EBITDA of INR 62.1 crores, supported by an executable order book of ~INR 697 crores (over three times FY26 revenue), giving substantial near-term revenue visibility and scale for accelerated growth.
Strategically, Concord is transitioning from product-led sales to a platform model with four pillars—green mobility (battery/hydrogen/hybrid propulsion), smart locomotive intelligence, railway safety (Kavach/MSDAC), and AI-driven diagnostics—aiming to convert one-off equipment sales into annuity, software and service revenues.
Fusion Electronics acquisition materially enhances in-house electronics, flex PCB and box-build capabilities with potential to meaningfully increase revenues and reduce import dependence; management expects Fusion to be a revenue contributor in the current year and cites full-scale capacity potential of roughly INR 200 crores.
Key execution risks center on working capital cycles and short-term debt volatility due to back-ended railway billing; however, management emphasizes disciplined execution, sovereign customer reliability, and planned conversion of backlog into revenue to support cash flows and margin expansion.
Industrial Manufacturing
Industrial Products
2,555 Cr
Moderate Risk
62.5
44.8
0.6
12.2
3,069.85
1,645.00
Sales CAGR
Profit CAGR
ROE
ROCE


