






Earnings Call/Transcript
Lumax Industries Q2/H1FY27 Earnings Call Intimation
Lumax Industries Ltd will hold an earnings call on 2026-10-27 at 11:00 IST to discuss operational and financial performance for Q2 and H1 ended September 30, 2026.



Welcome to Multibagg AI
Log in to access personalized features
IRIS
Multibagg AI is an AI powered stock research and analysis platform. We provide data, information, content, and analytics for publicly traded Indian companies listed on NSE and BSE. AI can make mistakes, check important information.
Research powered by GOALZEN CAPITAL SERVICES PRIVATE LIMITED · SEBI Research Analyst INH000013448
Prices might be delayed by a few minutes.
Join our Exclusive Community


Join our Exclusive Community
Made with 💙 in India. © Finsky Technologies Pvt Ltd. 2026


Get instant AI-powered insights about company performance, financials, and strategy. Ask questions about trends, competition, and developments while receiving responses backed by official documents and market data, with clear attribution to source documents.





 Discovery themes featuring this stock
Bearish
1
Neutral
8
Bullish
5
Bearish
33
Neutral
8
Bullish
5
Bearish
32
Neutral
0
Bullish
0
Bearish
1
Neutral
8
Bullish
5
Bearish
1
Neutral
8
Bullish
5
Bearish
32
Neutral
0
Bullish
0
Bearish
32
Neutral
0
Bullish
0
Bearish
32
Neutral
0
Bullish
0
Upcoming Result Date: Oct 25, 2026
View Standalone
View Standalone
View Standalone
View Standalone
View Standalone
View Standalone
View Standalone
View Standalone

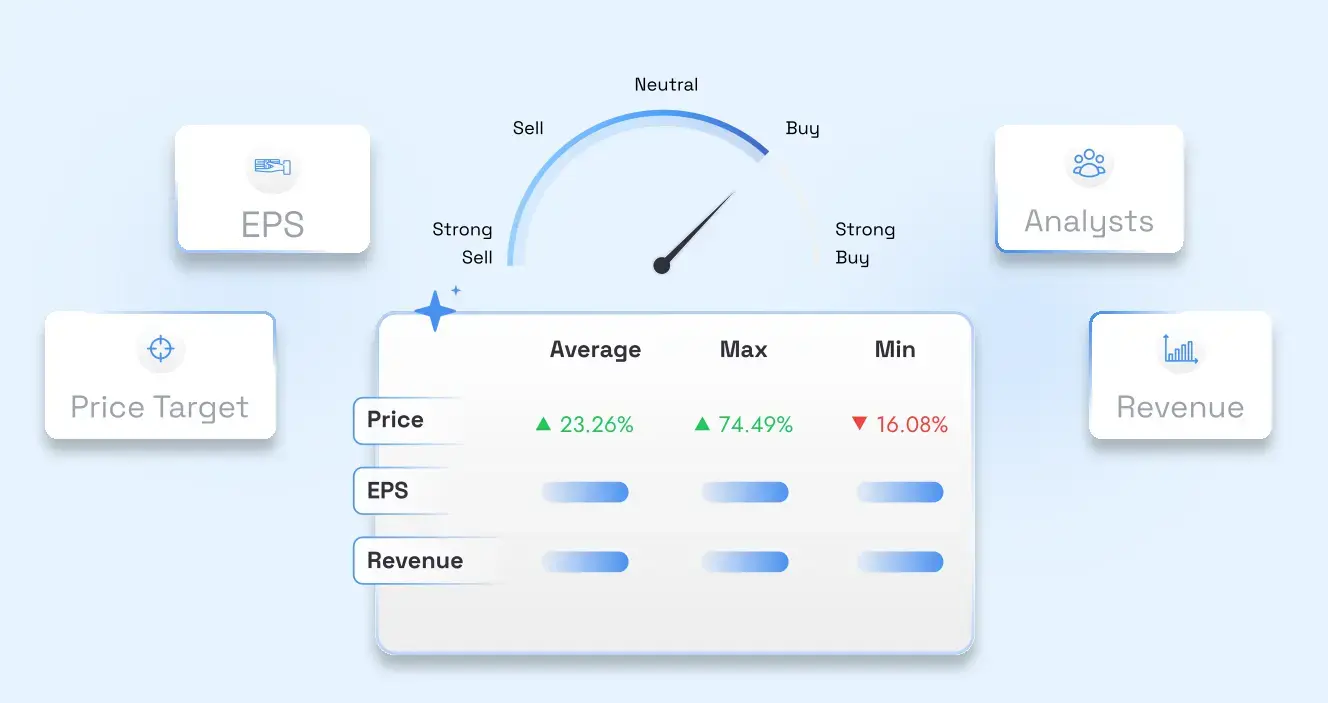








Lumax Industries Ltd (LUMAXIND) is currently trading at 5,299.95 per share. Stock prices fluctuate during market hours on NSE and BSE based on demand, company updates, and overall market conditions. Refer to the live price chart above for the most recent price movement.
Lumax Industries is an Indian automotive component manufacturer focused primarily on automotive lighting systems for passenger vehicles, two- and three-wheelers, and commercial vehicles, operating multiple manufacturing sites domestically and a wholly owned Czech design subsidiary to support product engineering and technology collaborations. Q1 FY27 consolidated revenue was INR 1,223 crore, up 32.6% year-on-year, with manufacturing revenue of INR 1,160 crore growing 36.8% y-o-y; EBITDA was INR 113 crore (9.2% margin) and PAT including associates was INR 51 crore, a 41.2% year-on-year increase, indicating operational leverage despite commodity headwinds. The company reports an order book of ~INR 2,500 crore with about 90% LED content and management guidance that c.60% of that will reach SOP in FY28, giving strong multi-quarter revenue visibility and underpinning an upward revision of FY27 capex to INR 200–250 crore tied to new program launches. Lumax is shifting from basic lighting to higher electronic content and premium features: LED now represents roughly 63% of revenue, front lighting 68%, and management is investing in SMT, PCB localization, embedded software POCs and a Czech R&D linkage to capture premiumization and value-add from ADAS and dynamic lighting trends. Key near-term risks highlighted include commodity and freight inflation from the West Asia crisis, rupee volatility and delayed OEM price recovery mechanisms, while stated objectives include margin recovery to 10.5–11% for FY27 and reaching higher mid-teens EBITDA over a multi-year horizon through localization and product mix improvements.
Over the past 52 weeks, Lumax Industries Ltd has traded between a low of ₹4,474.85 and a high of ₹6,969.90. The 52-week high and low indicate the stock’s price range over the last year and help investors understand its volatility and recent trading levels.
Lumax Industries Ltd has a market capitalization of approximately 4,971.82. Market capitalization represents the total value of a company’s outstanding shares and helps investors understand its size, stability, and relative risk compared to other listed companies.
Lumax Industries Ltd’s investment profile depends on its business fundamentals, valuation, and long-term outlook. The stock currently trades at a PE ratio of 26.53 and operates in the its sector sector. Investors typically assess financial performance, growth prospects, and individual risk tolerance before making investment decisions.
Based on its market capitalization of 4,971.82 Cr, Lumax Industries Ltd is classified as a Small Cap stock. Large-cap stocks are generally more stable, while mid-cap and small-cap stocks tend to offer higher growth potential along with higher price volatility.
Lumax Industries Ltd operates in the its sector sector. Sector classification matters because companies in the same sector are often affected by similar economic conditions, regulatory changes, and competitive dynamics, which can influence overall stock performance.
The Price-to-Earnings (PE) ratio of Lumax Industries Ltd is 26.53. The PE ratio compares a company’s share price to its earnings and is commonly used to assess valuation. Comparing the PE ratio with sector peers and historical levels provides better context.
Revenue from operations was ₹1,223.23 million and consolidated net profit was ₹510.8 million for Q1FY27 ended June 30, 2026.
Lumax Industries will host its Q1 FY27 earnings call on Tuesday, August 11, 2026 at 11:00 AM IST to discuss the quarter ended June 30, 2026.
Lumax Industries' share price surged 20% to hit the upper circuit after the company reported strong Q3 financial results, with a 39.2% rise in net profit and an 18.7% increase in revenue year-on-year.
| Symbol | Watchlist | Price | Market Cap | P/E | P/B | Div Yield (%) | ROE (%) | ROCE (%) | ROA (%) |
1690.55 | 5,392 Cr | 16.91 | 2.50 | 1.30 | 14.80 | 18.43 | 10.64 | ||
132.95 | 5,318 Cr | 22.75 | 4.64 | 1.88 | 20.14 | 28.53 | 14.18 | ||
5317.45 | 4,972 Cr | 26.53 | 5.42 | 1.03 | 18.80 | 15.36 | 5.45 | ||
1866.00 | 4,911 Cr | 18.67 | 4.04 | 2.14 | 21.04 | 26.88 | 15.46 | ||
827.40 | 4,750 Cr | 14.31 | 3.62 | 2.42 | 26.31 | 34.01 | 14.99 | ||
455.00 | 4,410 Cr | 29.29 | 4.58 | 1.25 | 14.83 | 18.16 | 11.11 | ||
159.10 | 4,174 Cr | 27.44 | 3.44 | 0.00 | 14.78 | 20.05 | 11.09 | ||
| Median: 7 Co. | — | 827.40 | 4,911 Cr | 22.75 | 4.04 | 1.30 | 18.80 | 20.05 | 11.11 |



Lumax Industries is an Indian automotive component manufacturer focused primarily on automotive lighting systems for passenger vehicles, two- and three-wheelers, and commercial vehicles, operating multiple manufacturing sites domestically and a wholly owned Czech design subsidiary to support product engineering and technology collaborations.
Q1 FY27 consolidated revenue was INR 1,223 crore, up 32.6% year-on-year, with manufacturing revenue of INR 1,160 crore growing 36.8% y-o-y; EBITDA was INR 113 crore (9.2% margin) and PAT including associates was INR 51 crore, a 41.2% year-on-year increase, indicating operational leverage despite commodity headwinds.
The company reports an order book of ~INR 2,500 crore with about 90% LED content and management guidance that c.60% of that will reach SOP in FY28, giving strong multi-quarter revenue visibility and underpinning an upward revision of FY27 capex to INR 200–250 crore tied to new program launches.
Lumax is shifting from basic lighting to higher electronic content and premium features: LED now represents roughly 63% of revenue, front lighting 68%, and management is investing in SMT, PCB localization, embedded software POCs and a Czech R&D linkage to capture premiumization and value-add from ADAS and dynamic lighting trends.
Key near-term risks highlighted include commodity and freight inflation from the West Asia crisis, rupee volatility and delayed OEM price recovery mechanisms, while stated objectives include margin recovery to 10.5–11% for FY27 and reaching higher mid-teens EBITDA over a multi-year horizon through localization and product mix improvements.
Auto Components
Auto Components & Equipments
4,955 Cr
High Risk
26.4
35.2
0.8
5.4
6,969.90
4,474.85
Sales CAGR
Profit CAGR
ROE
ROCE


