Actions
Action Type





IRIS
Multibagg AI is an AI powered stock research and analysis platform. We provide data, information, content, and analytics for publicly traded Indian companies listed on NSE and BSE. AI can make mistakes, check important information.
Prices might be delayed by a few minutes.
Join our Exclusive Community


Join our Exclusive Community
Made with 💙 in India. © Finsky Technologies Pvt Ltd. 2026


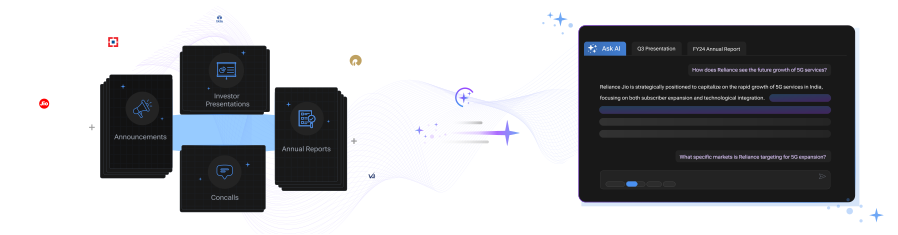
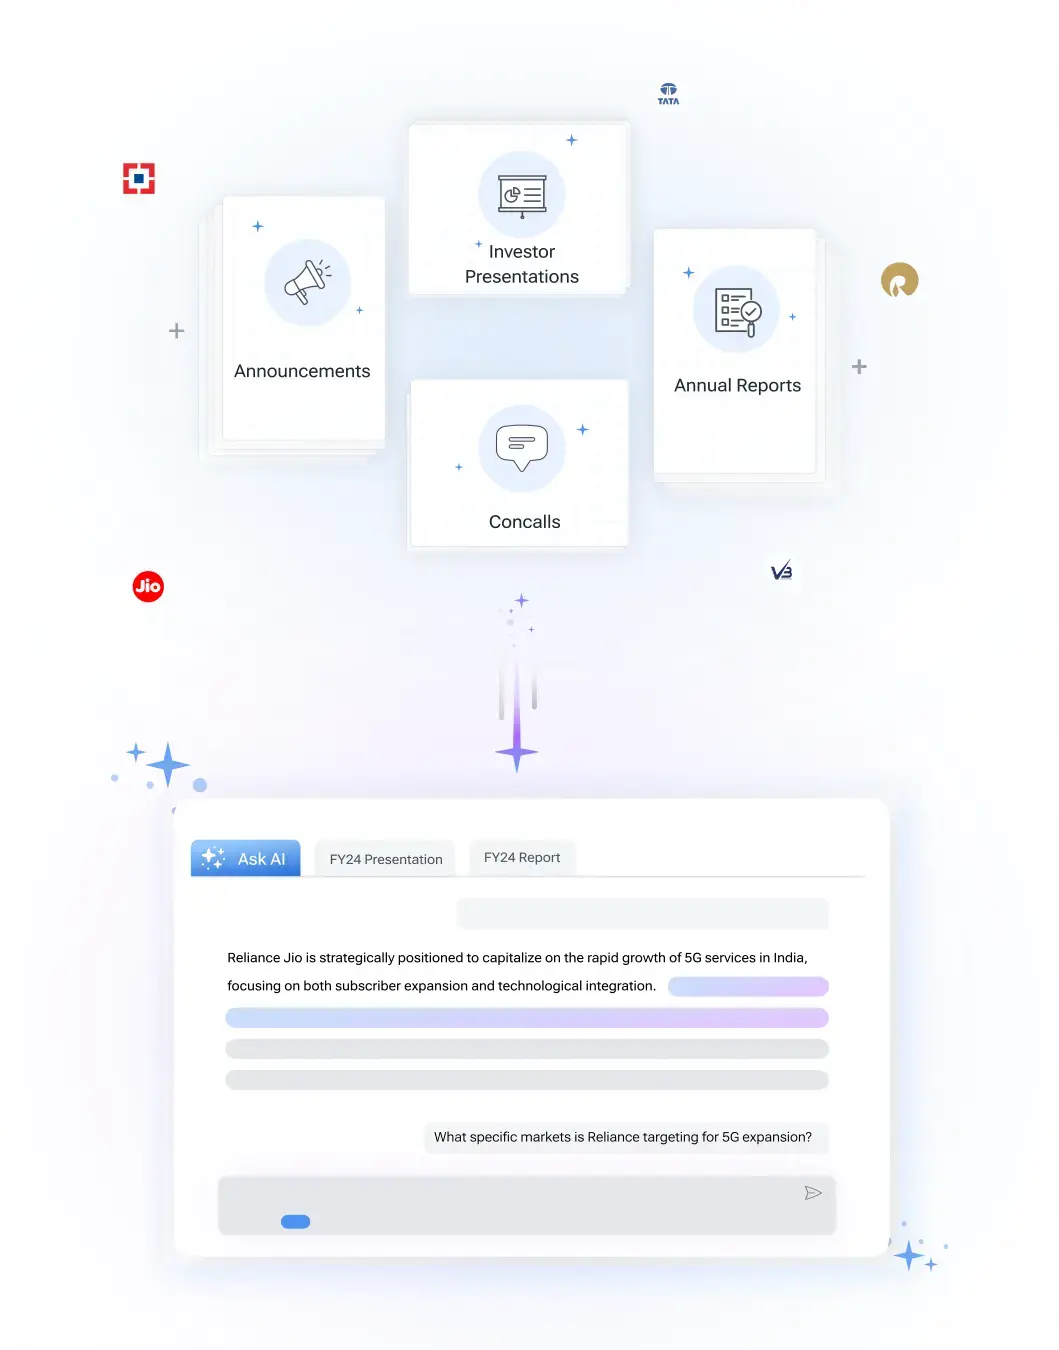
Get instant AI-powered insights about company performance, financials, and strategy. Ask questions about trends, competition, and developments while receiving responses backed by official documents and market data, with clear attribution to source documents.


 Discovery themes featuring this stock
Bearish
1
Neutral
7
Bullish
6
Bearish
18
Neutral
7
Bullish
21
Bearish
17
Neutral
0
Bullish
15
Bearish
17
Neutral
0
Bullish
15
Bearish
17
Neutral
0
Bullish
15
Bearish
17
Neutral
0
Bullish
15

 Discovery themes featuring this stock


Lux Industries Limited manufactures and sells branded innerwear, outerwear, thermals, rainwear, athleisure and related knitwear products across mass, mid-premium and premium segments. Its portfolio includes Lux Cozi, Lux Nitro, Lyra, ONN, Lux Venus, Lux Parker, Lux Champion, GenX and other internally operated brands, supported by nine manufacturing plants, more than 2 lakh retailers and exports to over 46 countries.
The company is deliberately shifting from a predominantly men's innerwear business toward a broader, professionally driven, multi-category and omnichannel platform. Recent launches span women's outerwear, lingerie, rainwear, thermal wear, socks, casualwear and economy innerwear, while online sales are targeted to reach Rs.200 crore within three years.
Reported revenue declined 7.7% year-on-year to Rs.718 crore in Q2 FY27 and 4.0% to Rs.1,328 crore during the first half. However, operating EBITDA margins improved from 5.6% to 6.4% in Q2 and from 5.7% to 6.6% in the first half, indicating better gross margins and operating resilience despite weak volumes.
Lux Industries Limited is investing heavily in brand creation and manufacturing despite near-term demand pressures. Branding investments reached Rs.1,351 crore over eight years, while the Dankuni expansion and a commissioned 4.5 lakh square-foot Hosiery Park facility provide capacity for future growth, although working-capital days and leverage have both increased.
The most visible strategic catalyst is the exclusive Reebok licensing partnership for Indian innerwear and thermals. Alongside premium celebrity endorsements, expanded digital channels and stronger export traction, the arrangement could accelerate premiumisation, but execution, royalty economics, consumer acceptance and the ability to protect margins remain important variables.
Textiles & Apparels
Garments & Apparels
3,522 Cr
High Risk
33.0
25.5
0.5
1.9
1,837.95
805.05
Sales CAGR
Profit CAGR
ROE
ROCE
View Standalone
View Standalone
View Standalone
View Standalone
View Standalone
View Standalone
View Standalone
View Standalone
Lux Industries Ltd (LUXIND) is currently trading at 1,158.75 per share. Stock prices fluctuate during market hours on NSE and BSE based on demand, company updates, and overall market conditions. Refer to the live price chart above for the most recent price movement.
Lux Industries Limited manufactures and sells branded innerwear, outerwear, thermals, rainwear, athleisure and related knitwear products across mass, mid-premium and premium segments. Its portfolio includes Lux Cozi, Lux Nitro, Lyra, ONN, Lux Venus, Lux Parker, Lux Champion, GenX and other internally operated brands, supported by nine manufacturing plants, more than 2 lakh retailers and exports to over 46 countries. The company is deliberately shifting from a predominantly men's innerwear business toward a broader, professionally driven, multi-category and omnichannel platform. Recent launches span women's outerwear, lingerie, rainwear, thermal wear, socks, casualwear and economy innerwear, while online sales are targeted to reach Rs.200 crore within three years. Reported revenue declined 7.7% year-on-year to Rs.718 crore in Q2 FY27 and 4.0% to Rs.1,328 crore during the first half. However, operating EBITDA margins improved from 5.6% to 6.4% in Q2 and from 5.7% to 6.6% in the first half, indicating better gross margins and operating resilience despite weak volumes. Lux Industries Limited is investing heavily in brand creation and manufacturing despite near-term demand pressures. Branding investments reached Rs.1,351 crore over eight years, while the Dankuni expansion and a commissioned 4.5 lakh square-foot Hosiery Park facility provide capacity for future growth, although working-capital days and leverage have both increased. The most visible strategic catalyst is the exclusive Reebok licensing partnership for Indian innerwear and thermals. Alongside premium celebrity endorsements, expanded digital channels and stronger export traction, the arrangement could accelerate premiumisation, but execution, royalty economics, consumer acceptance and the ability to protect margins remain important variables.
Over the past 52 weeks, Lux Industries Ltd has traded between a low of ₹805.05 and a high of ₹1,837.95. The 52-week high and low indicate the stock’s price range over the last year and help investors understand its volatility and recent trading levels.
Lux Industries Ltd has a market capitalization of approximately 3,521.69. Market capitalization represents the total value of a company’s outstanding shares and helps investors understand its size, stability, and relative risk compared to other listed companies.
Lux Industries Ltd’s investment profile depends on its business fundamentals, valuation, and long-term outlook. The stock currently trades at a PE ratio of 32.97 and operates in the its sector sector. Investors typically assess financial performance, growth prospects, and individual risk tolerance before making investment decisions.
Based on its market capitalization of 3,521.69 Cr, Lux Industries Ltd is classified as a Small Cap stock. Large-cap stocks are generally more stable, while mid-cap and small-cap stocks tend to offer higher growth potential along with higher price volatility.
Lux Industries Ltd operates in the its sector sector. Sector classification matters because companies in the same sector are often affected by similar economic conditions, regulatory changes, and competitive dynamics, which can influence overall stock performance.
The Price-to-Earnings (PE) ratio of Lux Industries Ltd is 32.97. The PE ratio compares a company’s share price to its earnings and is commonly used to assess valuation. Comparing the PE ratio with sector peers and historical levels provides better context.
Vertical A reported a 3.7-percentage-point increase in first-half gross margin to 35.4%, while advertising expense fell to Rs 41.8 crore from Rs 58.4 crore. These changes helped EBITDA rise to Rs 54.8 crore even though revenue from operations declined to Rs 604.3 crore.
Lux Industries reported an operating EBITDA margin of 6.4% in Q2 FY’27. This was 0.8 percentage points above the 5.6% reported in Q2 FY’26, as operating EBITDA increased to Rs 46 crore from Rs 44 crore.
Lux Industries has exclusive rights to manufacture and sell Reebok men’s and women’s innerwear and thermal wear within India through Vertical B. The presentation does not disclose rights for footwear, other apparel categories or sales outside India.
Lux Industries’ total expenses declined by Rs 60.46 crore year on year to Rs 692.07 crore, marginally exceeding the Rs 60.32 crore reduction in total income. Subcontracting and jobbing expenses fell by Rs 37.27 crore, while other expenses declined by Rs 8.75 crore. Tax expense also decreased to Rs 7.66 crore from Rs 8.41 crore.

| Symbol | Watchlist | Price | Market Cap | P/E | P/B | Div Yield (%) | ROE (%) | ROCE (%) | ROA (%) |
711.45 | 5,238 Cr | 38.49 | 2.28 | 0.00 | 5.93 | 9.33 | 3.06 | ||
1158.75 | 3,522 Cr | 32.97 | 1.87 | 0.18 | 5.47 | 7.43 | 3.40 | ||
69.31 | 3,361 Cr | 83.19 | 33.52 | 0.00 | 38.16 | 15.22 | 6.68 | ||
137.00 | 2,609 Cr | -87.86 | 2.51 | 0.38 | -0.54 | 1.88 | -0.93 | ||
419.10 | 2,586 Cr | 15.45 | 2.56 | 0.48 | 15.04 | 20.71 | 10.40 | ||
935.00 | 2,321 Cr | 21.59 | 2.30 | 0.32 | 10.63 | 12.82 | 6.10 | ||
261.55 | 2,193 Cr | 22.45 | 4.43 | 0.57 | 19.74 | 19.43 | 9.30 | ||
| Median: 7 Co. | — | 419.10 | 2,609 Cr | 22.45 | 2.51 | 0.32 | 10.63 | 12.82 | 6.10 |