










What is EPS and how is it calculated in 2026?
Quick Answer: EPS is earnings per share, a company's profit divided by its share count. It is the figure sitting underneath every price-to-earnings ratio, and the reason a P/E moves. The Nifty 50 closed at 23,779.15 on 7 September 2026 against a published P/E of 20.10.
One clarification first, because it causes constant confusion in India. In the share market EPS means earnings per share. In employment and provident fund contexts EPS means the Employees' Pension Scheme, which is an entirely different thing. This article is about the first.
What does EPS mean in the share market?
Earnings per share is the portion of a company's profit that belongs to each ordinary share.
Profit becomes comparable to a share price only once it is expressed per share. Consider the alternative: a company earning ₹500 crore tells you nothing next to one earning ₹50 crore until you know how many shares each of those profits is spread across. Reported profit arrives quarterly for listed companies, visible per instrument on the stocks hub.
What is the earnings per share formula?
EPS = profit for ordinary shareholders ÷ weighted average ordinary shares in issue.
Two details in that sentence do the work. Profit here means after tax, and after anything owed to preference shareholders; it is not headline revenue. The denominator is a weighted average across the period rather than the closing share count. Shares issued halfway through a year were only outstanding for half of it, and the weighting is what accounts for that.
That weighted average is where most hand-calculations go wrong. A company that doubles its share count on the last day of the year has barely changed the weighted average for that year, so its EPS falls only slightly. Do the same on day one and the average nearly doubles, and EPS roughly halves. Same total shares at the year end, very different EPS — which is why the denominator has to be read as a period measure, not a snapshot.
What is the difference between basic and diluted EPS?
The basic figure works off the share count as it stands. Diluted EPS counts the shares that would exist if everything convertible into equity converted.
Employee stock options, convertible debentures and warrants all create claims on future shares. Diluted EPS assumes those claims are exercised, which raises the share count and therefore lowers the per-share figure. Companies report both, and the diluted number is the more conservative of the two.
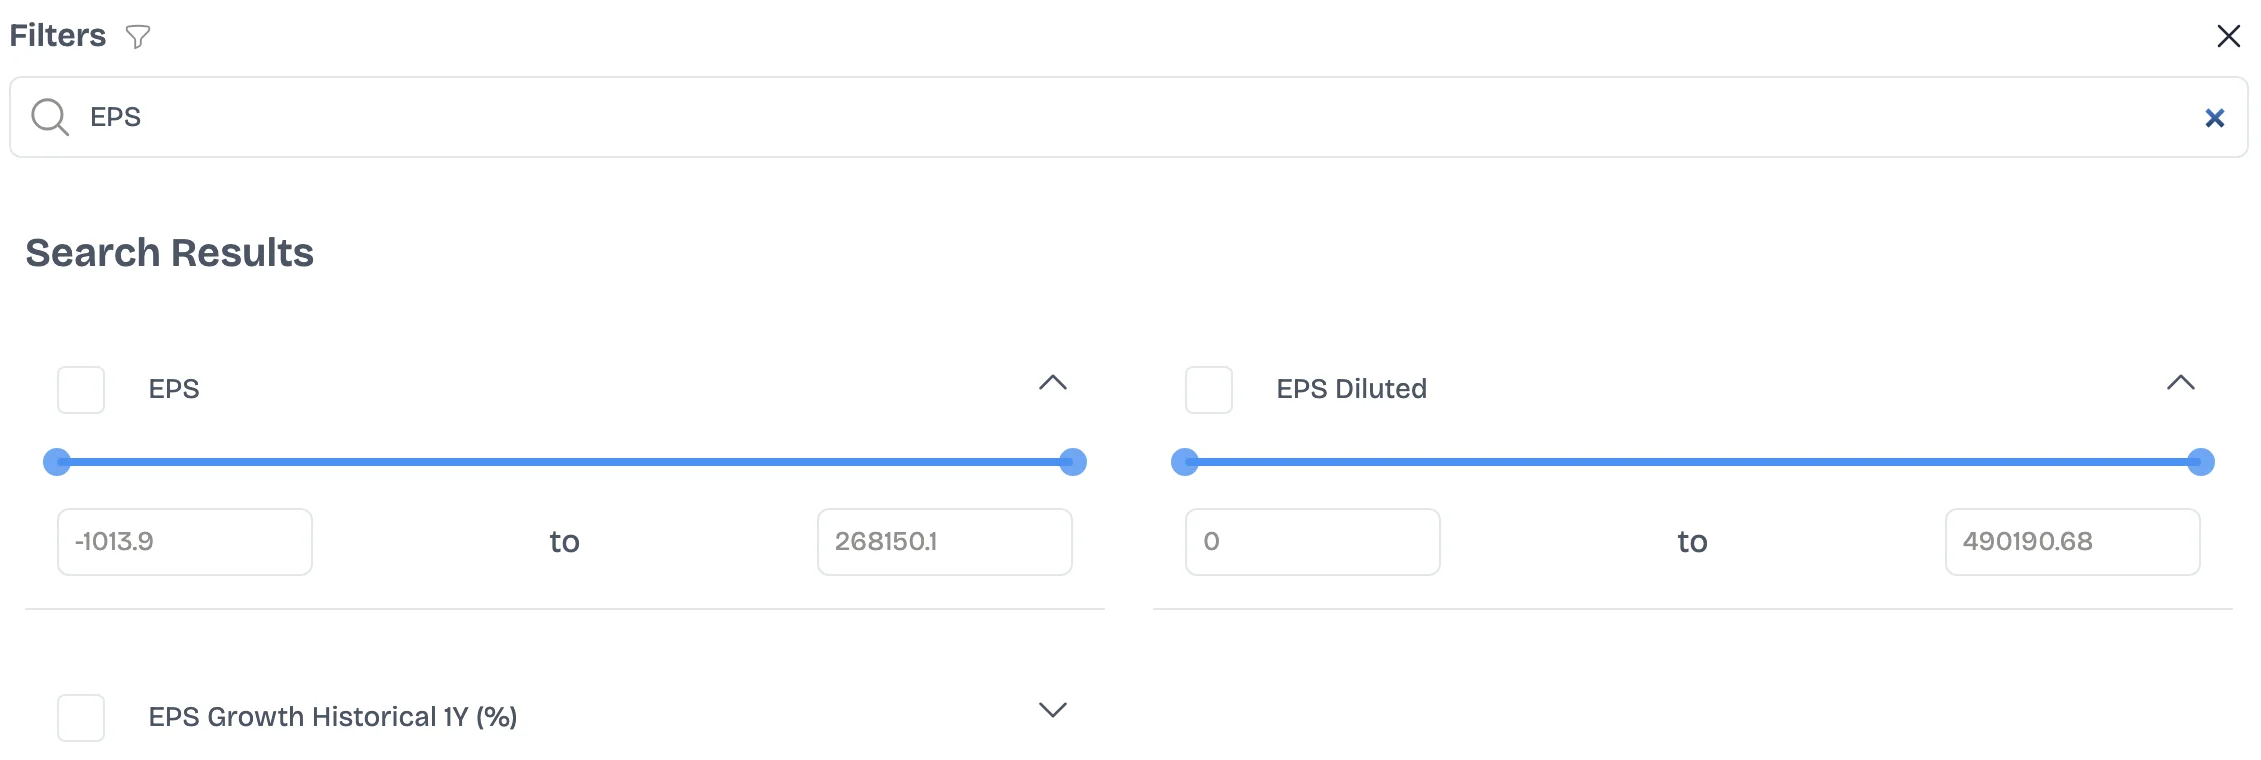
Basic and diluted EPS are held as two separate fields, which is what lets the gap between them be screened rather than inferred. Screenshot taken 15 September 2026.
Mind the gap between the two figures. A wide one says a meaningful quantity of future equity has already been promised to someone.
What does EPS look like behind index levels in India in 2026?
An index carries a P/E of its own, and the same earnings logic sits underneath it.
Each index below is shown at its settled close with the P/E NSE publishes against it.
| Index | Close, 7 September 2026 | P/E | Earnings yield |
|---|---|---|---|
| Nifty Bank | 57,088.30 | 13.51 | 7.40% |
| Nifty Next 50 | 72,575.75 | 19.19 | 5.21% |
| Nifty 50 | 23,779.15 | 20.10 | 4.98% |
| Nifty Midcap Select | 14,650.70 | 31.98 | 3.13% |
Closes: NSE, as of 7 September 2026. P/E: NSE, as of 8 September 2026. Earnings yield computed as 1 ÷ P/E from the published ratio in the preceding column.
The last column is the earnings yield, and it is simply the P/E turned upside down. Where a P/E of 20.10 says the market is paying 20.10 times one year's earnings, an earnings yield of 4.98% says those earnings amount to 4.98% of what is being paid. The two carry identical information; the yield form is the more useful one when the comparison is against something else quoted as a percentage, such as a bond or a deposit rate.
It is also the one per-unit figure this table can honestly carry. Dividing an index level by its P/E looks like it would yield earnings per index unit, but NSE does not state which level its ratio is struck against, so that result would rest on an assumption rather than a source. Inverting the ratio needs no such assumption: 1 ÷ P/E is arithmetic on the published number alone, whatever base it was struck against. NSE Indices computes the Nifty 50 on free-float market capitalisation, which shapes the earnings behind the index without being published as a per-unit number.
The spread runs from 13.51 to 31.98 on P/E, or 7.40% down to 3.13% on earnings yield, across four indices drawn from the same market on the same day. Each of those ratios has an earnings figure underneath it, and the ratio moves whenever either half does.
How does EPS connect to the P/E ratio?
Divide a share price by EPS and you have the P/E, which makes EPS the quieter half of the better-known ratio.
That makes the two inseparable. A falling P/E has two possible causes, a lower price or higher earnings, and they are not the same event.
Anyone reading the ratio without knowing which one moved is reading half the story. The same split shows up at index level, where the Nifty 50 carries a published P/E alongside its level, and both fields sit side by side across listed companies in Multibagg's screener.
What is TTM EPS?
It means the figure is built from the four latest reported quarters instead of the most recent completed financial year.
Annual figures go stale fast. By the third quarter, last year's EPS is describing a period that ended nine months ago, while the trailing twelve-month version has already absorbed three newer quarters of trading. Quarterly results are where those updates arrive, browsable by financial year on the earnings tracker.
Is a higher EPS better?
Not as a comparison between companies, because EPS depends on the share count and share counts are arbitrary.
Take two identical businesses on the same total profit; the one with fewer shares outstanding reports the larger EPS. Comparing raw EPS across companies therefore compares share structures as much as performance.
Where the figure earns its keep is tracked over time for a single company, or fed into a ratio such as P/E that puts the price back in. Earnings move with the wider economy too, which is why arguments about India's headline growth reach aggregate earnings expectations, and why a single quarter can swing sharply for one company.
Common Mistakes
Five errors account for most misread EPS figures.
- Confusing the two EPS meanings. In the share market it is earnings per share; in provident fund contexts it is the Employees' Pension Scheme.
- Comparing raw EPS between companies. Share counts differ, so the comparison measures share structure as much as profit.
- Using basic where diluted matters. If a company has issued large numbers of options or convertibles, the basic figure overstates what each share really earns.
- Missing exceptional items behind an EPS jump. Reported EPS includes one-off gains and losses — an asset sale, a court settlement, a restructuring charge, an impairment. Adjusted EPS strips those out to show the underlying run rate, and the two can differ sharply in a year where something unusual happened. A reported EPS that leaps on the back of a land sale has not told you the business earned more. Check whether a change came from operations or from an exceptional item before reading it as a trend, and note that "adjusted" is not a standardised term: each company decides what it excludes.
- Reading a falling P/E as cheapness. At the Nifty 50's 20.10 on 8 September 2026, the ratio moves when either the level or the earnings behind it moves, and only one of those is good news.
Frequently Asked Questions
Can EPS be negative?
Yes. When a company reports a loss, the loss divided by the share count gives a negative EPS, sometimes labelled loss per share. A price-to-earnings ratio computed on a negative EPS is meaningless, which is why screeners and index providers usually show the P/E as not applicable for loss-making companies rather than as a negative number.
How does a bonus issue or a stock split affect EPS?
EPS falls in proportion, because the share count rises while profit is unchanged. A one-for-one bonus halves it and a five-for-one split divides it by five. Indian accounting standards require the EPS of earlier periods to be restated for the new share count, so a company's historical EPS series stays comparable after the event. A fall in EPS across a bonus or split is arithmetic, not a decline in the business.
Does a share buyback increase EPS?
Usually. A buyback extinguishes shares, so the same profit is divided across fewer of them and EPS rises. The effect is partly offset because the cash spent on the buyback no longer earns interest, which trims profit slightly. The rise in EPS reflects a smaller denominator rather than any improvement in the operating business, and it should be read with that in mind.
What is the difference between EPS and dividend per share?
EPS is the profit earned per share, whether or not it is paid out. Dividend per share is the portion of that profit actually distributed in cash. The ratio of the two is the payout ratio, so a company earning ₹50 per share and paying ₹15 has a payout ratio of 30%, with the remaining ₹35 retained in the business and added to reserves.
Where does a listed Indian company report its EPS?
In its quarterly and annual results filed with NSE and BSE under Regulation 33 of SEBI's listing regulations. Both basic and diluted EPS appear as line items in the results, and the accounting standard on earnings per share, Ind AS 33, sets out how each is computed. The filing states whether a quarterly figure is annualised, which matters when comparing it with a full-year number.
Why do consolidated and standalone EPS differ for the same company?
Because they divide different profits across the same shares. Standalone EPS uses the profit of the parent company alone; consolidated EPS uses the profit of the whole group, including subsidiaries, after removing the share belonging to minority holders in those subsidiaries. For a company with large subsidiaries the two can be far apart, and the P/E quoted for it depends on which one the source used.
Disclaimer
Disclaimer: This article is for informational and educational purposes only and is not investment, financial, legal or tax advice. Multibagg AI does not recommend whether to buy, sell or hold any security. Figures are as of the dates stated and may change. Consult a SEBI-registered investment adviser before making any investment decision.


Aaditya Aanand is the founder and CEO of Multibagg AI. An IIT Kanpur alumnus, he has worked across technology and financial markets at Goldman Sachs and American Express. His writing explores investing, markets and AI.