










What is the PEG ratio and how is it used in 2026?
Quick Answer: The PEG ratio divides a company's price-to-earnings ratio by its expected earnings growth rate. It exists because P/E alone cannot compare a slow grower with a fast one. On 8 September 2026 the Nifty Bank traded at a P/E of 13.51 and the Nifty Midcap Select at 31.98.
Those two numbers are the reason the PEG ratio was invented. A P/E of 13.51 is not automatically cheaper than one of 31.98, because the two groups are not expected to grow at the same rate. PEG is the attempt to put growth into the denominator.
What is the full form of the PEG ratio?
The three letters expand to price/earnings to growth. It is the price-to-earnings ratio divided by an expected earnings growth rate.
That order is not accidental. P/E comes first because it is the thing being adjusted; growth comes second because it does the adjusting. PEG is not a separate valuation model at all. It is one ratio divided by one number.
The measure is most closely associated with Peter Lynch, who ran Fidelity's Magellan fund and popularised it in One Up on Wall Street. His formulation is the one still quoted: a company's P/E should broadly match its earnings growth rate, which is the same as saying a PEG near 1 is the reference point. Almost every explanation of the ratio traces back to that claim — offered, it is worth noting, as a rule of thumb rather than a valuation method.
What is the PEG ratio formula?
PEG = P/E ÷ expected annual earnings growth, where the growth figure is entered as a plain number and not as a percentage.
A company on a P/E of 30 with expected growth of 15% a year has a PEG of 2. The same P/E of 30 against expected growth of 30% gives a PEG of 1. The arithmetic is trivial; every difficulty in the ratio sits in where that growth figure comes from.
What does the PEG ratio mean in the share market?
It means a P/E has been placed next to a growth expectation instead of being read on its own.
P/E answers how many years of current earnings the market is paying for, and stops there; whether those earnings are rising or falling, it does not say. PEG's claim is that a high P/E can be reasonable when earnings grow quickly, and a low one unremarkable when they do not.
What do P/E levels look like across benchmarks in India in 2026?
Wide enough that comparing them without context is meaningless. These are NSE's published figures for 8 September 2026.
| Index | P/E | Dividend yield |
|---|---|---|
| Nifty Bank | 13.51 | 0.69 |
| Nifty Financial Services | 15.91 | 0.96 |
| Nifty Next 50 | 19.19 | 1.00 |
| Nifty 100 | 19.92 | 1.16 |
| Nifty 50 | 20.10 | 1.19 |
| Nifty Midcap Select | 31.98 | 0.50 |
Source: NSE, as of 8 September 2026, market open. Levels move intraday.
From 13.51 to 31.98 is a factor of more than two, across indices drawn from the same market on the same day. Current figures sit on NSE's Nifty 50 index tracker; the constituents behind them can be followed through Multibagg's Nifty 50 index page.
There is deliberately no growth column, and its absence is the point. NSE publishes a P/E and a dividend yield against each index, but no expected earnings growth rate, because no such figure exists as an observation. Adding one would mean importing somebody's forecast and presenting it as exchange data — the very weakness that makes two published PEG ratios for the same company disagree, and the reason a real PEG has to be built one company at a time from that company's own filings.
What does a worked PEG ratio look like for an Indian company?
It looks like four figures from two published sources, and a division anyone can check.
Take HDFC Bank Ltd (NSE: HDFCBANK). Its audited results for the year ended 31 March 2026 report standalone basic EPS of ₹48.62 for FY26 against ₹44.15 for FY25, and equity share capital of ₹1,539.34 crore at ₹1 face value, so 1,539.34 crore shares. The AMFI list for the six months ended 30 June 2026 puts its average market capitalisation over that half-year at ₹12,86,453 crore.
| Input | Figure | Source |
|---|---|---|
| Average market capitalisation, Jan–Jun 2026 | ₹12,86,453 crore | AMFI |
| Shares outstanding | 1,539.34 crore | Reg 33 filing |
| Implied average share price | ₹835.72 | computed |
| Basic EPS, FY26 | ₹48.62 | Reg 33 filing |
| Trailing P/E | 17.19 | computed |
| EPS growth, FY25 to FY26 | 10.12% | computed from ₹44.15 to ₹48.62 |
| PEG | 1.70 | 17.19 ÷ 10.12 |
Computed from the two filings linked above. The market-cap input is a six-month average and the earnings input a full financial year, so this is a trailing PEG on overlapping rather than identical windows — stated here rather than smoothed over.
Two things about that 1.70 matter more than the number. It is a trailing P/E divided by historical EPS growth, so it describes what has already happened; most published PEG ratios use a forward P/E and a forecast growth rate, and will not match it. And one year of EPS growth is a fragile denominator — a three or five-year earnings CAGR smooths out an unusual year and is the more common choice, which is another reason two sources reach different answers for the same company.
What is PEGY?
PEGY is the PEG ratio with dividend yield added to the denominator: P/E ÷ (earnings growth rate + dividend yield). It exists because a company returning cash to shareholders delivers part of its return outside the earnings growth figure, so PEG alone penalises a mature, high-payout business for growing slowly.
The same HDFC Bank figures show the effect. For FY26 the bank declared a total dividend of ₹15.50 per share — a ₹2.50 special interim dividend paid on 11 August 2025 plus a ₹13.00 final dividend recommended to the annual general meeting. Against the implied average price of ₹835.72 that is a dividend yield of 1.85%, so PEGY = 17.19 ÷ (10.12 + 1.85) = 1.43, against a PEG of 1.70 on identical data. The dividend leg moves the ratio by a quarter of its value, which is the whole argument for the variant — and it is what the dividend yield column in the table above is for.
How is a PEG ratio interpreted?
The convention treats 1 as the point where the P/E equals the expected growth rate. Below 1 the P/E is lower than growth; above 1 it is higher.
That is arithmetic, not a verdict. The claim commonly attached to it — Peter Lynch's rule of thumb that a PEG under 1 marks a bargain — assumes the growth estimate is accurate, that growth persists over the horizon used, and that nothing else about the business differs. All three assumptions fail regularly.
What is a good PEG ratio?
The conventional band reads a PEG under 1 as cheap relative to growth, 1 to 2 as broadly fair, and above 2 as expensive. In the Indian market that framing carries three caveats heavy enough to change the answer.
Indian benchmark P/E levels are high against the growth rates most large companies actually post, so PEG values under 1 are uncommon among established large caps, and a screen set at "PEG below 1" often returns an almost empty list — the worked example above lands at 1.70. Second, a PEG under 1 built on a forecast of 30% growth is a statement about the forecast, not the company, and fast-growing mid and small caps are where growth estimates are least reliable. Third, the ratio ignores debt, cash generation, earnings quality and promoter pledging entirely.
The usable version of the rule is comparative: read a PEG against the same company's own history and against direct sector peers computed on the same growth horizon. Across two sources using different horizons it is not a comparison at all.
PEG also ignores everything its denominator does not contain. Debt, cash generation, margin durability and earnings quality sit outside the ratio entirely, so two companies with identical PEG values can carry very different balance sheets — visible on the stocks hub, not in PEG.
What does a negative PEG ratio mean?
Usually that the ratio has stopped being usable rather than that it is signalling something.
Two routes lead there. Either earnings are negative, which drags the P/E itself below zero, or earnings are expected to shrink, which does the same to the growth denominator. Either way the output is a number the ratio was never designed to produce. Discard it rather than ranking it.
Why do two sources publish different PEG ratios for the same company?
Because the numerator is observed and the denominator is an estimate.
Price is published and earnings are reported, so two sources broadly agree on the P/E — provided they mean the same P/E. A trailing P/E divides today's price by the last twelve months of reported earnings; a forward P/E divides it by an estimate of the coming year's. Those are different numbers for the same company on the same day, and the article's own worked example uses the trailing version.
The denominator diverges further still, because growth is a forecast. Forecasts differ by horizon, by method, and by whoever made them: one source reaches for a two-year estimate, another a five-year EPS growth CAGR, and a third abandons forecasting altogether and uses historical growth.
This is the single most useful thing to know about PEG: the value is only as meaningful as the growth assumption inside it, and that assumption is rarely shown alongside the number. Growth expectations also move with the wider economy, which is why arguments about India's headline growth figures and about what a private company is worth turn on the same problem.
Where does a stock screener fit?
A screener is where a ratio stops being a definition and becomes a filter you can apply across a list.
Multibagg's screener carries valuation and growth fields across NSE and BSE listed companies, so a P/E filter can be set beside a growth filter rather than read one company at a time.
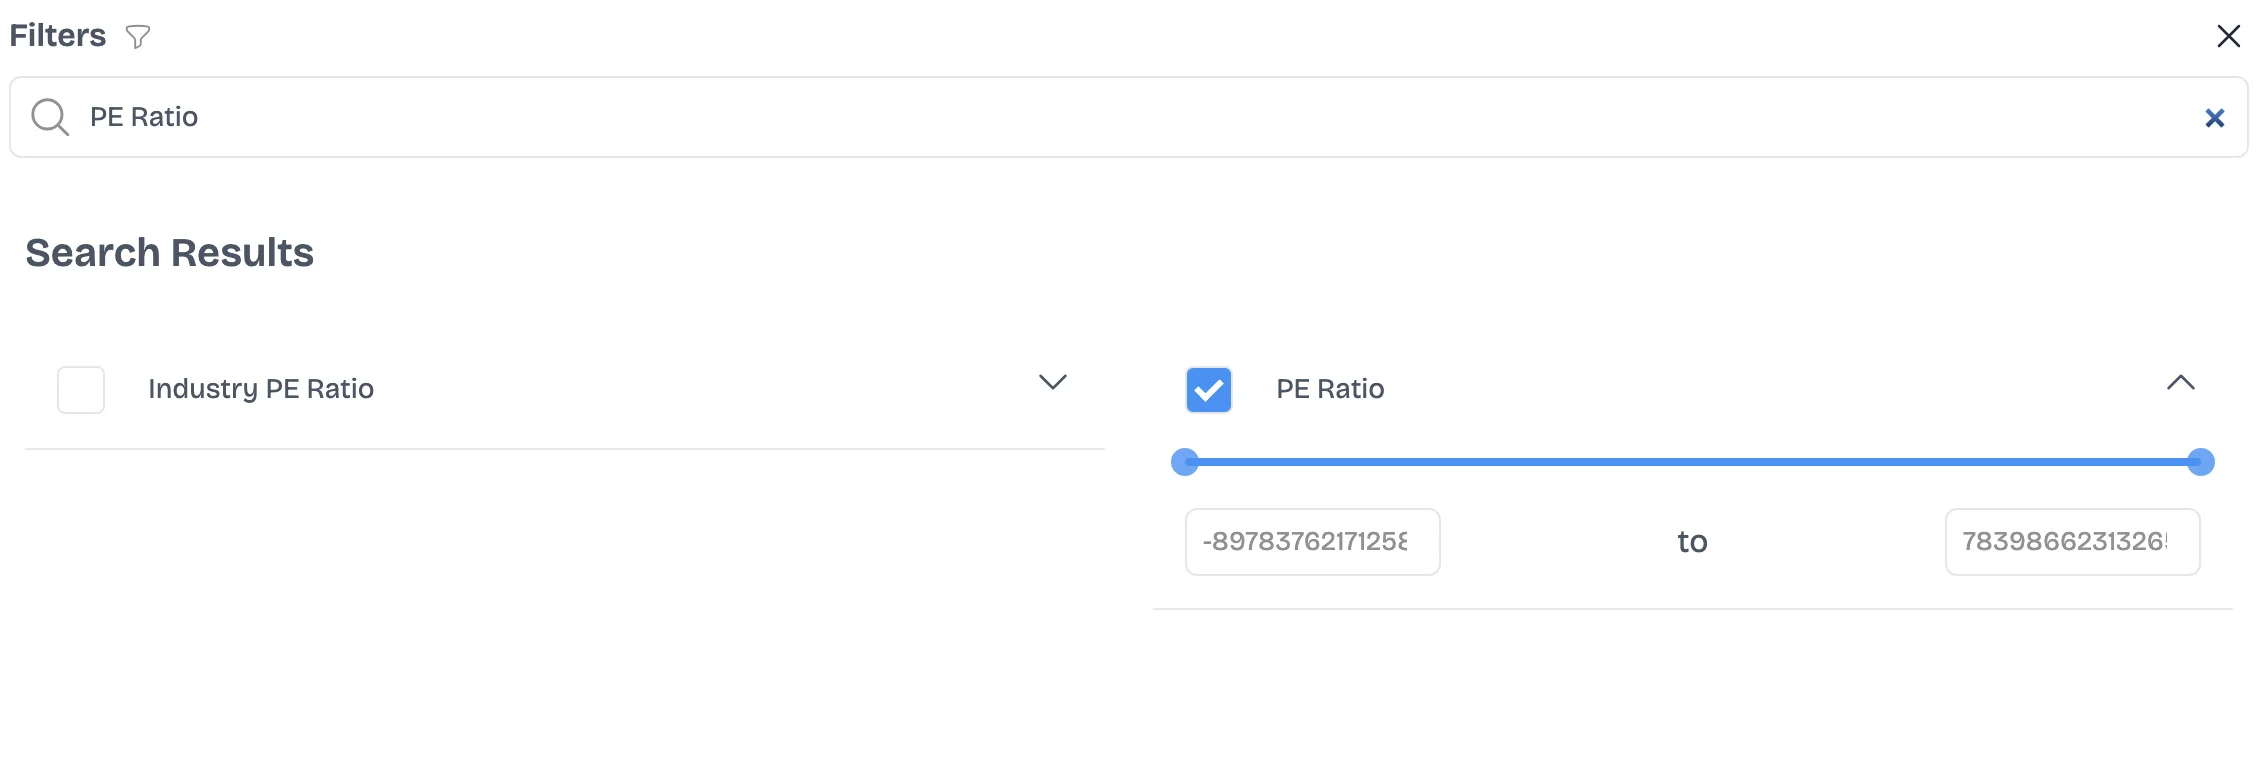
The P/E half of a PEG is a screener field; the growth half has to be chosen and stated. Screenshot taken 15 September 2026. The same applies when a business is being valued ahead of listing, as the Reliance Jio IPO valuation discussion shows.
Common Mistakes
Four errors account for most misuse of the ratio.
- Treating PEG as a verdict. It is a P/E divided by an estimate, not a conclusion about a company.
- Comparing PEG values from different sources. Different growth horizons produce different answers from identical price and earnings data.
- Using a negative PEG. Negative earnings or negative expected growth break the ratio; the output is not a low number, it is an invalid one.
- Comparing across sectors without checking the base. Nifty Bank sat at a P/E of 13.51 against Nifty Midcap Select at 31.98 on 8 September 2026, and those groups do not share a growth profile.
Frequently Asked Questions
Who invented the PEG ratio?
The ratio is most closely associated with Peter Lynch, the Fidelity fund manager who popularised it in One Up on Wall Street. His formulation was that a company's P/E should roughly match its earnings growth rate, which is the origin of treating a PEG near 1 as the reference point.
Does a stock split or bonus issue change a PEG ratio?
No. A split divides the share price and the earnings per share by the same factor, so the P/E is unchanged, and the growth rate is computed on per-share earnings restated for the same event, so the denominator is unchanged too. A PEG that moves across a split has been computed on an unadjusted EPS series, which is a data error rather than a valuation signal.
Why does a PEG ratio collapse when earnings recover from a low base?
Because growth is measured from the prior year, and a rebound from a very small earnings figure registers as an enormous percentage. A company whose EPS rises from ₹1 to ₹4 shows 300% growth, which turns any P/E into a PEG well below 1 without the business having become cheap. The same base effect runs the other way after an unusually strong year, which is why a multi-year growth rate is the more common input.
Can a PEG ratio be compared between an Indian company and one listed abroad?
Not directly. Growth expectations, interest rates and inflation differ between markets, so a P/E that looks high in one can be ordinary in another because the earnings behind it are expected to compound at a different pace. Accounting standards differ too: an Indian company reports under Ind AS while a US-listed peer reports under US GAAP, so even the earnings figure in the numerator is not built on identical rules.
What growth rate should go into a PEG ratio?
Whichever one you are prepared to state alongside the answer. A single year of EPS growth is volatile, so a three or five-year earnings CAGR is the more common choice. The horizon changes the result materially, so a PEG quoted without its growth basis cannot be checked or compared.
Does a PEG ratio work for banks?
It applies, but with care. Bank earnings move with credit cycles and provisioning decisions, so one year of EPS growth can reflect a provisioning change rather than the underlying business. Banks also carry structurally different balance sheets, none of which the ratio captures, so sector peers are the only fair comparison.
Disclaimer
Disclaimer: This article is for informational and educational purposes only and is not investment, financial, legal or tax advice. Multibagg AI does not recommend whether to buy, sell or hold any security. Figures are as of the dates stated and may change. Consult a SEBI-registered investment adviser before making any investment decision.


Aaditya Aanand is the founder and CEO of Multibagg AI. An IIT Kanpur alumnus, he has worked across technology and financial markets at Goldman Sachs and American Express. His writing explores investing, markets and AI.