










Aeroflex Enterprises Q2 FY26 Revenue Rises 25.08% to ₹172.35 Crore
Key highlights
- AEL reported Q2 FY26 revenue from operations of ₹172.35 crore, up 25.08% year on year.
- AEL’s Q2 FY26 consolidated total income was ₹180.39 crore, up 21.00% year on year.
- Q2 FY26 EBITDA was ₹37.68 crore, with an EBITDA margin of 20.89%.
- Q2 FY26 PAT was ₹20.44 crore and the PAT margin was 11.33%, down 368 basis points year on year.
powered by IRIS
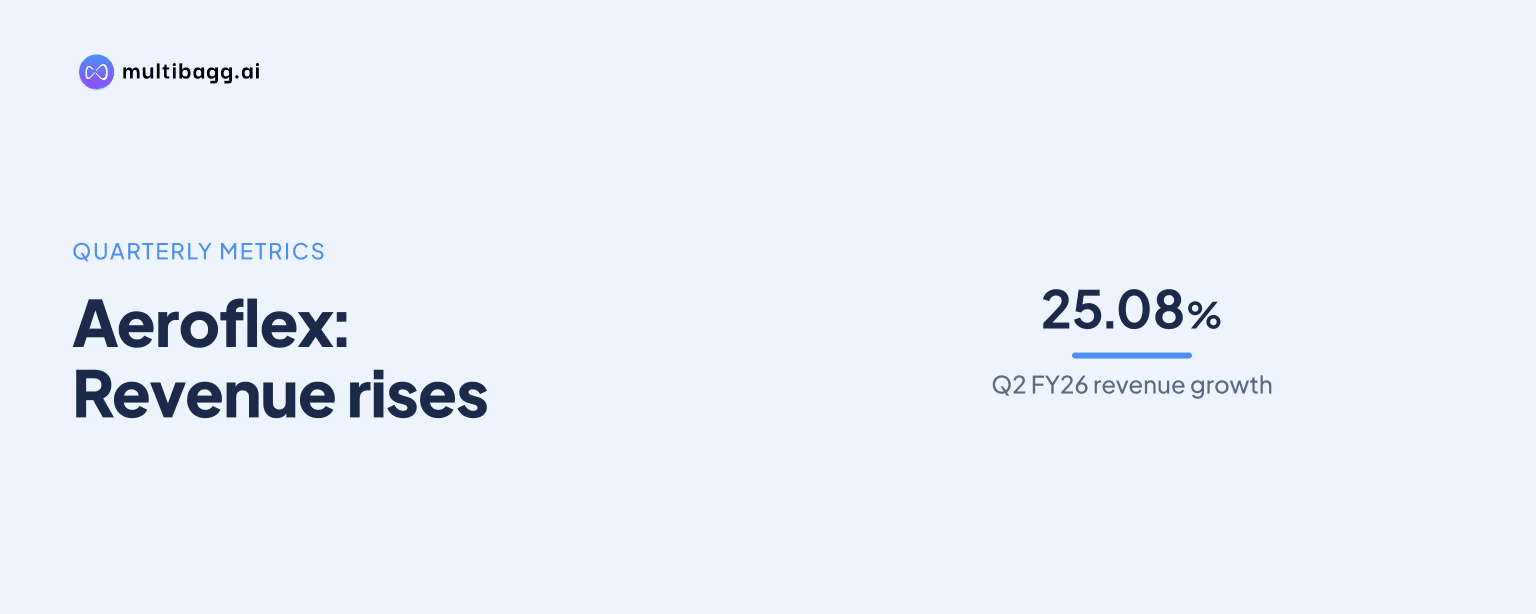
Aeroflex Enterprises Limited reported consolidated revenue from operations of ₹172.35 crore in Q2 FY26, up 25.08% year on year, while profit after tax was ₹20.44 crore. The quarterly update matters because it showed continued growth across the group’s operating businesses, although the PAT margin was lower than the year-earlier period.
Know Aeroflex Enterprises inside out
Results, valuation, peers and who's buying, in one view.
What did Aeroflex Enterprises Limited report in Q2 FY26?
Aeroflex Enterprises Limited, referred to as AEL, reported consolidated total income of ₹180.39 crore for Q2 FY26, representing year-on-year growth of 21.00%. Revenue from operations was ₹172.35 crore. The presentation reported EBITDA of ₹37.68 crore and PAT of ₹20.44 crore for the quarter.
AEL’s EBITDA margin was 20.89%, while its PAT margin was 11.33%. The PAT margin declined by 368 basis points from the corresponding quarter of the prior year. The company’s investor presentation provided the reported financial figures, but no earnings-call transcript for the quarter was available in the supplied material.
How did AEL’s quarterly financial performance compare across key measures?
AEL’s reported revenue growth of 25.08% was higher than the 21.00% increase in total income during Q2 FY26. Total income includes items beyond revenue from operations, whereas revenue from operations measures income generated by the company’s business activities.
The quarter’s EBITDA of ₹37.68 crore translated into a 20.89% margin, and PAT of ₹20.44 crore translated into an 11.33% margin. The gap between EBITDA and PAT reflects the effect of costs and items recorded after operating profit, although the presentation excerpt does not provide a detailed bridge for those items.
Which businesses were included in AEL’s operating portfolio?
AEL describes itself as a diversified Indian industrial and investment group. Its activities include engineered fluid connectors, flow-control and thermal-management components, packaging and FIBC operations through Aeroflex Neu, a fintech lending arm, startup investments, and strategic acquisitions, divestments and partnerships.
Aeroflex Industries Limited is a key business within the portfolio. AEL reported a 66.99% stake in Aeroflex Industries, including indirect holding. The business manufactures flexible flow solutions and exports to global markets, with operations listed at Taloja in Navi Mumbai, Lodha-Palava in Thane, and Chakan in Pune.
The Q2 FY26 presentation listed Aeroflex Industries revenue of ₹111.05 crore, 2,976 global customers, a presence in 91 countries, 87 machine lines and production capacity of 16.5 million metres. These operating statistics describe the scale of the subsidiary’s flexible-flow-solutions business, but the supplied material does not provide a standalone profit figure for it.
Got a follow-up? Ask IRIS
What is the wider financial context for AEL’s Q2 FY26 numbers?
The Q2 FY26 update followed a period in which AEL reported growth in its consolidated business. For FY26, the company reported total income of ₹726.10 crore, up 19.80% year on year, EBITDA of ₹149.81 crore with a 20.63% margin, and PAT of ₹85.33 crore with an 11.75% margin.
AEL later reported total income of ₹333.16 crore in Q1 FY27, up 134.55% year on year, alongside EBITDA of ₹161.43 crore and PAT of ₹103.22 crore. The supplied material states that Q1 FY27 PAT included proceeds from the sale of its MRO stake. That disclosure is important when comparing the later quarter’s profit with the operating result reported in Q2 FY26.
AEL also said in its Q3 FY26 update that Aeroflex Industries had entered the liquid cooling solutions segment for next-generation data centres and AI infrastructure. Management stated that the subsidiary had signed a long-term contract with a listed US corporation and dispatched its first commercial order. No revenue contribution from that activity was specified in the supplied Q2 FY26 data.
How do the Q2 FY26 figures matter for investors and operations?
The Q2 FY26 results showed that AEL increased revenue from operations by 25.08% while maintaining an EBITDA margin of 20.89%. For investors, the reported margin data provides a measure of operating profitability alongside top-line growth. The decline in PAT margin by 368 basis points is a separate point to monitor because net profitability grew at a different rate from revenue.
AEL’s portfolio structure also makes consolidated figures relevant across several businesses rather than a single manufacturing line. Aeroflex Industries’ customer reach, export presence and manufacturing footprint are material operational indicators within that portfolio. However, the supplied presentation does not assign the group’s quarterly consolidated EBITDA or PAT to individual subsidiaries.
The company announced an investor presentation for the quarter and half year ended September 30, 2026 on November 4, 2026. The supplied extract confirms that the presentation was disclosed under Regulation 30 of the Listing Obligations and Disclosure Requirements Regulations, but it does not provide the financial figures for that later period.
Conclusion
AEL’s Q2 FY26 presentation recorded consolidated revenue from operations of ₹172.35 crore, total income of ₹180.39 crore and PAT of ₹20.44 crore. Revenue growth was 25.08% year on year, while the reported PAT margin of 11.33% was 368 basis points below the prior-year quarter.
The next disclosed item to track is AEL’s presentation for the quarter and half year ended September 30, 2026, announced on November 4, 2026. Investors can compare the later disclosed operating figures with Q2 FY26 while accounting for the stated MRO-stake sale proceeds included in Q1 FY27 PAT.