










Afcons operating margin falls to 1.7% as ratios weaken year on year
Key highlights
- Afcons’ consolidated operating margin fell to 1.70% in the September 2026 quarter from 9.65% a year earlier.
- Debt-service coverage ratio declined to 1.46 times in September 2026 from 1.85 times in September 2025.
- The current ratio fell to 1.15 times, while long-term debt to working capital rose to 0.84 times.
- Afcons used Rs 340.33 crore in operating cash flow during the half year ended 30 September 2026.
powered by IRIS
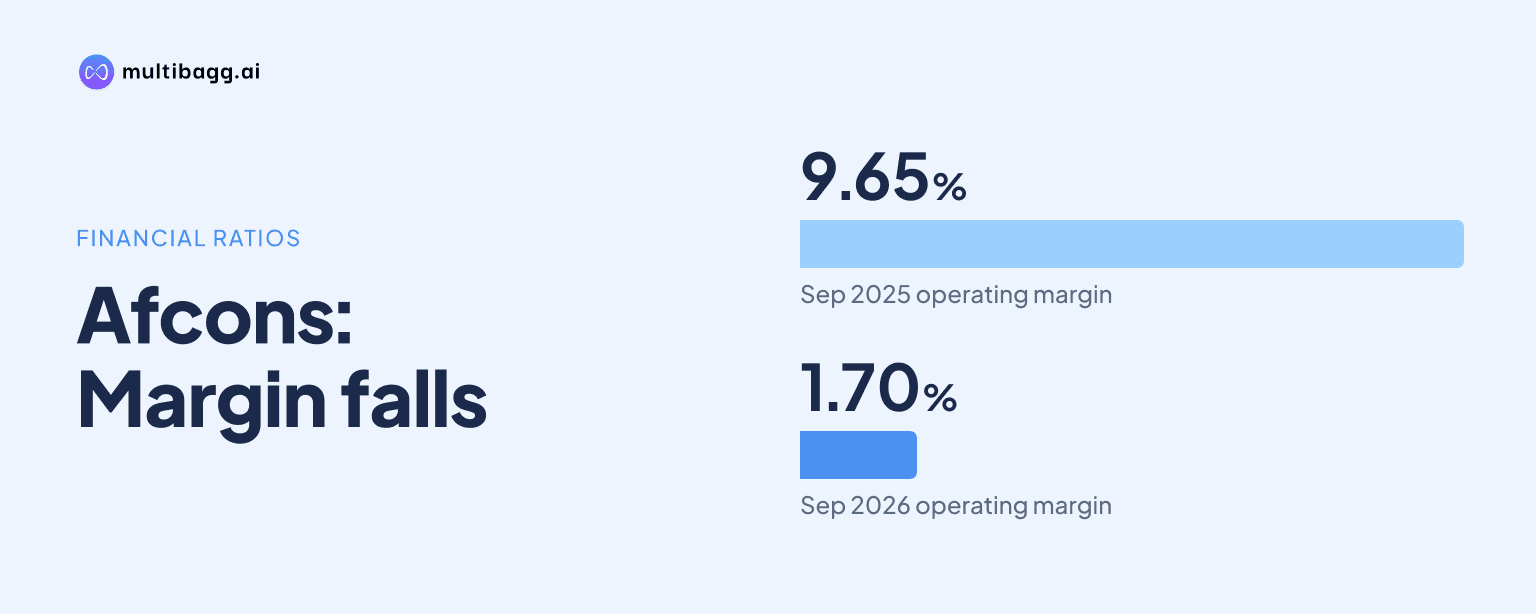
Afcons Infrastructure Limited’s consolidated operating margin fell to 1.70% in the quarter ended 30 September 2026 from 9.65% a year earlier. Afcons also reported a debt-service coverage ratio of 1.46 times and a current ratio of 1.15 times, while debt measures rose relative to equity, assets and working capital.
Know Afcons Infrastructure inside out
Results, valuation, peers and who's buying, in one view.
Why did Afcons’ operating margin decline in September 2026?
Afcons’ operating margin was 1.70% in the September 2026 quarter, compared with 7.75% in the June 2026 quarter and 9.65% in the September 2025 quarter. The year-on-year change was a 7.95-percentage-point decline, while the sequential change was 6.05 percentage points. For the half year ended 30 September 2026, the margin was 4.74%, against 10.76% in the corresponding half year of 2025.
Afcons defines operating margin as profit before depreciation, interest, tax and exceptional items, less other income, divided by revenue from operations. The company said quarterly margins vary with the nature, type and quantum of project work executed, and that quarterly results may not indicate annual performance. Its September 2026 results also included Rs 183.33 crore of other income from interest on an arbitration award, which is excluded under the disclosed operating-margin formula.
The movement was not confined to operating margin. Net profit margin was 1.56% in the September 2026 quarter, above 1.15% in June 2026 but below 3.52% in September 2025. For the half year, net profit margin was 1.35%, compared with 3.81% a year earlier, while the full-year March 2026 figure was 2.10%.
How did Afcons’ debt-service and interest coverage change?
Afcons’ debt-service coverage ratio, or DSCR, was 1.46 times in the September 2026 quarter, down from 1.85 times a year earlier, though above 1.15 times in June 2026. For the half year ended 30 September 2026, DSCR was 1.30 times, compared with 2.01 times in the prior-year half year and 1.69 times for the year ended 31 March 2026.
The company calculates DSCR using profit after tax plus interest, depreciation and exceptional items, divided by interest expense and specified long-term borrowing repayments. Interest-service coverage ratio, or ISCR, which uses profit before tax plus interest, depreciation and exceptional items relative to interest expense, fell to 2.33 times in the September 2026 quarter from 3.09 times in September 2025. The half-year ISCR declined to 2.19 times from 3.35 times.
Afcons’ debt-equity ratio rose to 0.87 times at 30 September 2026 from 0.64 times a year earlier and 0.65 times at 31 March 2026. Total debt to total assets reached 0.25 times, versus 0.19 times in September 2025 and 0.18 times in March 2026. These disclosed measures show debt increased relative to both equity and the asset base over those comparison dates.
Got a follow-up? Ask IRIS
What do Afcons’ liquidity and working-capital ratios show?
Afcons’ current ratio was 1.15 times at 30 September 2026, compared with 1.34 times a year earlier and 1.29 times at 30 June 2026. The ratio is calculated as current assets divided by current liabilities. Current assets were Rs 12,066.10 crore and current liabilities were Rs 10,509.14 crore at 30 September 2026, compared with Rs 12,953.97 crore and Rs 10,011.43 crore respectively at 31 March 2026.
Long-term debt to working capital increased to 0.84 times in the September 2026 quarter from 0.26 times in September 2025 and 0.48 times in June 2026. Afcons defines the measure as long-term borrowings, including current maturities, divided by current assets less current liabilities excluding current maturities of long-term borrowings. Current-liability ratio was 0.75 times, compared with 0.72 times a year earlier.
The balance sheet records non-current borrowings of Rs 1,267.58 crore at 30 September 2026, up from Rs 919.60 crore at 31 March 2026. Current borrowings rose to Rs 3,497.45 crore from Rs 2,618.67 crore. Total equity changed marginally to Rs 5,465.24 crore from Rs 5,450.58 crore, while total liabilities rose to Rs 13,955.25 crore from Rs 13,680.30 crore.
How did cash flows and project assets affect Afcons’ position?
Afcons used Rs 340.33 crore in operating activities during the half year ended 30 September 2026, an improvement from Rs 668.64 crore used in the corresponding 2025 half year. Operating profit before working-capital changes declined to Rs 644.90 crore from Rs 953.07 crore, while a Rs 682.22 crore increase in contract assets was the largest listed working-capital cash outflow.
The company’s investing cash outflow rose to Rs 373.61 crore from Rs 184.12 crore, including Rs 706.24 crore of payments for property, plant and equipment, compared with Rs 234.19 crore a year earlier. Financing activities generated Rs 833.73 crore, including net short-term borrowing proceeds of Rs 932.89 crore and long-term borrowing proceeds of Rs 502.88 crore. Cash and cash equivalents ended the period at Rs 504.18 crore, versus Rs 385.70 crore at the start of the half year.
Trade receivables in non-current assets rose to Rs 1,024.01 crore at 30 September 2026 from Rs 606.57 crore at 31 March 2026, while non-current contract assets increased to Rs 2,045.56 crore from Rs 1,497.04 crore. Current contract assets were broadly unchanged at Rs 6,209.35 crore compared with Rs 6,234.46 crore. Debtors turnover fell to 2.50 times from 3.18 times in the September 2025 quarter, and inventory turnover declined to 3.97 times from 4.87 times.
Conclusion
The September 2026 disclosures show that lower operating profitability occurred alongside reduced debt-service and interest coverage, lower liquidity and higher debt relative to several balance-sheet measures. Operating cash outflow narrowed to Rs 340.33 crore from Rs 668.64 crore a year earlier, but financing cash inflow of Rs 833.73 crore included Rs 932.89 crore of net short-term borrowing proceeds.
The next issue to watch is the resolution of claims carried in project-related assets and their related proceedings. The TTA joint venture has recognised Rs 659.87 crore of contract assets, Rs 120.81 crore of non-current trade receivables, Rs 30.63 crore of other non-current financial assets and Rs 25.77 crore of bank-guarantee amounts; management considers them recoverable, while stating that arbitration and court outcomes remain uncertain. Afcons also reported Rs 115 crore of non-current contract assets related to the Chenab bridge project, where arbitration proceedings are ongoing.