










Alletec: Overseas customers provided 58% of H1 FY’27 revenue
Key highlights
- International customers generated Rs 44.80 crore, or 58.0% of Alletec's H1 FY’27 revenue.
- US/Canada revenue reached Rs 33.74 crore and rose 26.7% year on year in H1 FY’27.
- The Americas accounted for 57.3% of Alletec's H1 FY’27 services revenue.
- Alletec added 8 international customers and 5 domestic customers in H1 FY’27.
powered by IRIS
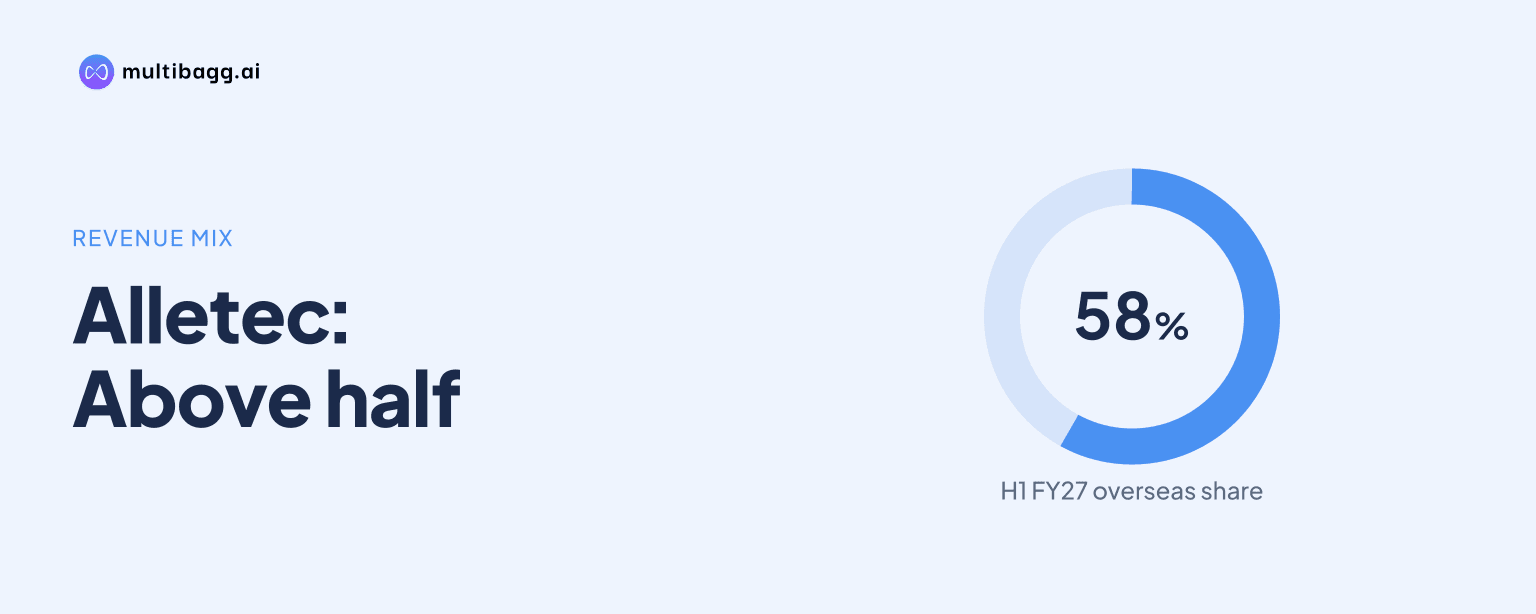
Alletec generated 58.0% of its first-half (H1) FY’27 revenue outside India, with the customer-region sales ledger reporting Rs 44.80 crore, up 19.2% year on year. US/Canada supplied Rs 33.74 crore and grew 26.7%, exceeding India’s Rs 32.47 crore revenue and 8.8% growth.
Know All E Technologies inside out
Results, valuation, peers and who's buying, in one view.
How much of Alletec's H1 FY’27 revenue came from international customers?
International customers supplied Rs 44.80 crore, or 58.0%, of Alletec's H1 FY’27 revenue in the customer-region sales ledger. That revenue rose 19.2% year on year, while India generated Rs 32.47 crore, up 8.8%. Consolidated total revenue, excluding other income, was Rs 77.28 crore for H1 FY’27, an increase of 14.6% year on year.
The disclosed overseas total covers US/Canada, Africa, Asia-Pacific (APAC), Europe and the Middle East. The listed regional figures total Rs 44.80 crore after rounding, compared with Rs 32.47 crore from India. International customers therefore represented the larger portion of the sales ledger in H1 FY’27.
Alletec added eight international customers in H1 FY’27, compared with five domestic customers. Over the same period, total product revenue rose 27.9% year on year to Rs 36.56 crore, while total services revenue increased 4.9% to Rs 40.72 crore.
Which overseas region contributed the most to Alletec's revenue?
US/Canada was Alletec's largest reported customer region, contributing Rs 33.74 crore in H1 FY’27 and recording 26.7% year-on-year growth. Its revenue exceeded India’s Rs 32.47 crore and made up most of the Rs 44.80 crore generated outside India. Africa was the second-largest overseas region at Rs 5.00 crore, up 12.6%.
The smaller overseas regions showed different growth rates. APAC delivered Rs 2.61 crore and rose 0.8%, while Europe generated Rs 1.86 crore and increased 6.3%. Middle East revenue was Rs 1.59 crore, down 26.4%, making it the only listed customer region with a year-on-year decline.
The presentation groups the United States and Canada together and does not identify individual customers within the Rs 33.74 crore regional total. It also does not provide prior-period revenue values by region, beyond the disclosed growth rates for H1 FY’27.
How concentrated is Alletec's services revenue in the Americas?
The Americas accounted for 57.3% of Alletec's H1 FY’27 services revenue, the largest geographic share in the services breakdown. India accounted for 25.1%, followed by Africa at 7.8%, APAC excluding India at 4.4%, Europe at 4.1% and the Middle East at 1.3%. These shares refer to services revenue rather than the overall customer-region sales ledger.
The Americas share was 53.6% in the second quarter (Q2) FY’27, 3.7 percentage points below its 57.3% share for H1 FY’27. Africa moved in the opposite direction, at 12.7% in Q2 FY’27 versus 7.8% for H1 FY’27, while India was nearly unchanged at 25.0% and 25.1%, respectively.
The two regional disclosures use different labels: the sales ledger reports US/Canada, whereas the services table reports the Americas. Alletec reported total services revenue of Rs 40.72 crore in H1 FY’27, up 4.9% year on year, but does not disclose a rupee value for the Americas services share.
Got a follow-up? Ask IRIS
What do Alletec's product and services figures show about international business?
International product revenue was Rs 14.31 crore in H1 FY’27, up 67.1% year on year, while international services revenue was Rs 30.50 crore, up 5.1%. Domestic product revenue was Rs 22.26 crore, up 11.1%, and domestic services revenue was Rs 10.22 crore, up 4.2%.
Product revenue grew faster than services at the consolidated level as well. Product revenue increased 27.9% to Rs 36.56 crore, compared with 4.9% growth in services revenue to Rs 40.72 crore. Services remained the larger consolidated category by Rs 4.16 crore.
Alletec described the H1 FY’27 revenue mix as 47% licenses and 53% services, and reported repeat and recurring revenue of 91.3%. The presentation does not state whether the repeat and recurring measure differs by geography or by product and services revenue.
Which industries and customer accounts were material in H1 FY’27?
Professional Services was Alletec's largest disclosed industry category in H1 FY’27 at 34%, followed by Manufacturing at 13% and Green Energy and engineering, procurement and construction (EPC) at 12%. Retail and Education each accounted for 11%, bringing the five largest listed categories to 81% of the industry mix.
Financial Services represented 6%, Food and Beverages 5%, Trade and Distribution 3%, Digital Native 3% and Travel 2%. Alletec does not provide a region-by-industry breakdown, so the presentation does not link US/Canada's 26.7% growth to a specific industry category.
The top five customer accounts accounted for 29.0% of revenue in H1 FY’27, compared with 20.5% in H1 FY’26. The top 10 accounted for 38.3%, up from 29.4%, while the five named anchor-account revenue figures total Rs 22.38 crore.
Conclusion
Alletec’s H1 FY’27 data indicates that its revenue mix was weighted toward customers outside India, with US/Canada the principal reported regional contributor and the Americas the largest services geography. Product revenue expanded faster than services, while services remained the larger consolidated revenue category during the half year.
The next disclosed commercial development to watch is ARC 365, for which Alletec reported two paying customers, one in India and one in Kenya, plus four active conversations with potential customers. Management described this as early commercial validation, not as material revenue or a forecast that the discussions will convert.