










Alpex Solar Q2 FY27 Revenue Falls 27% to ₹381.59 Crore
Key highlights
- Alpex Solar reported Q2 FY27 revenue of ₹381.59 crore, down 27.0% year on year.
- Q2 FY27 EBITDA was ₹53.20 crore, with an EBITDA margin of 13.94%.
- Q2 FY27 PAT was ₹20.20 crore, down 61.7% year on year, with a 5.29% margin.
- H1 FY27 PAT rose to ₹94.95 crore from ₹60.06 crore in H1 FY26.
powered by IRIS
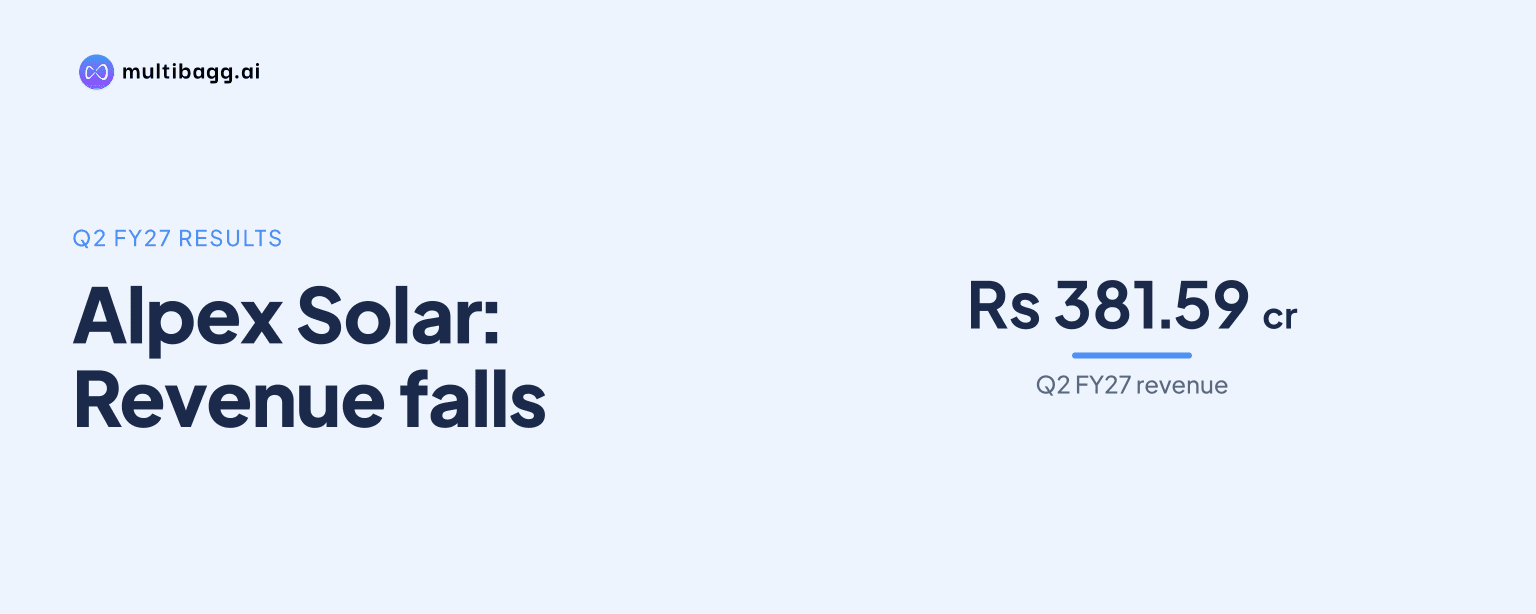
Alpex Solar Limited reported Q2 FY27 revenue of ₹381.59 crore, down 27.0% year on year, while profit after tax fell 61.7% to ₹20.20 crore. The September-quarter performance matters because it followed a June-quarter revenue increase and came as the solar module manufacturer pursues additional funding and capacity expansion.
Know Alpex Solar inside out
Results, valuation, peers and who's buying, in one view.
What did Alpex Solar report for Q2 FY27?
Alpex Solar reported revenue from operations of ₹381.59 crore for Q2 FY27, alongside EBITDA of ₹53.20 crore and profit after tax of ₹20.20 crore. EBITDA margin was 13.94%, while PAT margin was 5.29%, according to the company's Q2 FY27 investor presentation published on November 13, 2026.
The reported quarterly revenue was 27.0% lower than a year earlier, while net profit was 61.7% lower year on year. The supplied results information identifies the period as the July-September 2026 quarter. These are reported financial figures and do not indicate an investment recommendation.
How did the September-quarter result compare with Alpex Solar's recent performance?
Alpex Solar's Q2 FY27 revenue of ₹381.59 crore was below the ₹503 crore revenue reported for Q1 FY27 in the supplied company information. Q1 FY27 revenue was stated to have risen 32.5% year on year, while profit after tax for that quarter was ₹39.9 crore, down 5.1% year on year.
The Q1 FY27 operating margin was reported at 14.8%. By comparison, Q2 FY27 EBITDA margin was 13.94%, a difference of 0.86 percentage points. Q2 PAT of ₹20.20 crore was also lower than the Q1 PAT figure provided, although the source does not separately explain the causes of the sequential movement.
The company had earlier informed exchanges that its board approved unaudited standalone and consolidated financial results for the quarter ended June 30, 2026, on August 14, 2026. The Q2 investor presentation was published on November 13, 2026, the date scheduled for the board to consider the September-quarter results in the supplied material.
What do the H1 FY27 figures show?
Alpex Solar's H1 FY27 revenue was reported at ₹903.24 crore, compared with ₹885.01 crore in H1 FY26. EBITDA increased to ₹144.10 crore from ₹130.98 crore, while PAT rose to ₹94.95 crore from ₹60.06 crore, based on the year-on-year comparison cited from page 14 of the investor presentation.
This means revenue increased by ₹18.23 crore in the half year, EBITDA increased by ₹13.12 crore, and PAT increased by ₹34.89 crore. The half-year comparison shows growth over the corresponding prior-year period even though the supplied Q2 figures show year-on-year declines for revenue and profit.
Got a follow-up? Ask IRIS
Why are the quarterly margins and funding plans relevant?
Alpex Solar's Q2 EBITDA margin of 13.94% and PAT margin of 5.29% show the share of quarterly revenue retained before interest, tax, depreciation and amortisation, and after tax, respectively. The difference between the two margins underlines that the fall in quarterly PAT was sharper than the fall in revenue disclosed for the period.
The company has also approved fundraising of ₹125 crore through unlisted secured non-convertible debentures. Separately, the supplied information states that Alpex Solar raised ₹260.17 crore through a new share issue to increase solar module manufacturing capacity to 3.6 GW by FY27. These are distinct capital-raising disclosures and should be assessed separately from operating earnings.
The information also identifies solar panels and solar pump and EPC operations among the reported business lines for the June 2026 quarter. Solar panel revenue was ₹424.997 crore and solar pump and EPC revenue was ₹76.436 crore in that quarterly disclosure, with values converted from the stated lakh denomination.
How does the result affect investors and the solar manufacturing business?
For investors, the September-quarter data places attention on the contrast between weaker year-on-year Q2 revenue and profit and the higher H1 FY27 revenue, EBITDA and PAT figures reported against H1 FY26. The source does not provide a detailed management explanation for the Q2 year-on-year decline, so the figures alone cannot establish whether it arose from volume, pricing, product mix, costs or other factors.
For operations, the disclosed plan to reach 3.6 GW of module manufacturing capacity by FY27 links capital raising to expansion. The NCD approval and prior share issue indicate that financing remains relevant to that plan. Customers, suppliers and industry participants may monitor subsequent disclosures for progress on capacity, funding deployment and quarterly profitability.
Conclusion
Alpex Solar reported a softer Q2 FY27, with revenue of ₹381.59 crore and PAT of ₹20.20 crore, both lower year on year. At the same time, the H1 FY27 comparison supplied by the company showed higher revenue, EBITDA and PAT than in H1 FY26, making the relationship between the quarterly and half-year trends important for financial analysis.
The next areas to watch are the company's disclosed target of expanding module manufacturing capacity to 3.6 GW by FY27 and any updates on the use of ₹125 crore of approved NCD funding and ₹260.17 crore raised through shares. Further results disclosures may also provide more detail on the operational factors behind the September-quarter movement.