










Black Rose Industries inventory rose 42% in six months
Key highlights
- Black Rose Industries’ inventory rose 42% to Rs 67.93 crore at September 30, 2026, from Rs 47.99 crore at March 31.
- Black Rose Industries’ trade payables to other creditors increased 87% to Rs 46.74 crore over the six months.
- Black Rose Industries’ cash-flow statement recorded a Rs 26.25 crore increase in payables, provisions and other liabilities.
- Black Rose Industries generated Rs 35.66 crore of net operating cash flow in the half year ended September 30, 2026.
powered by IRIS
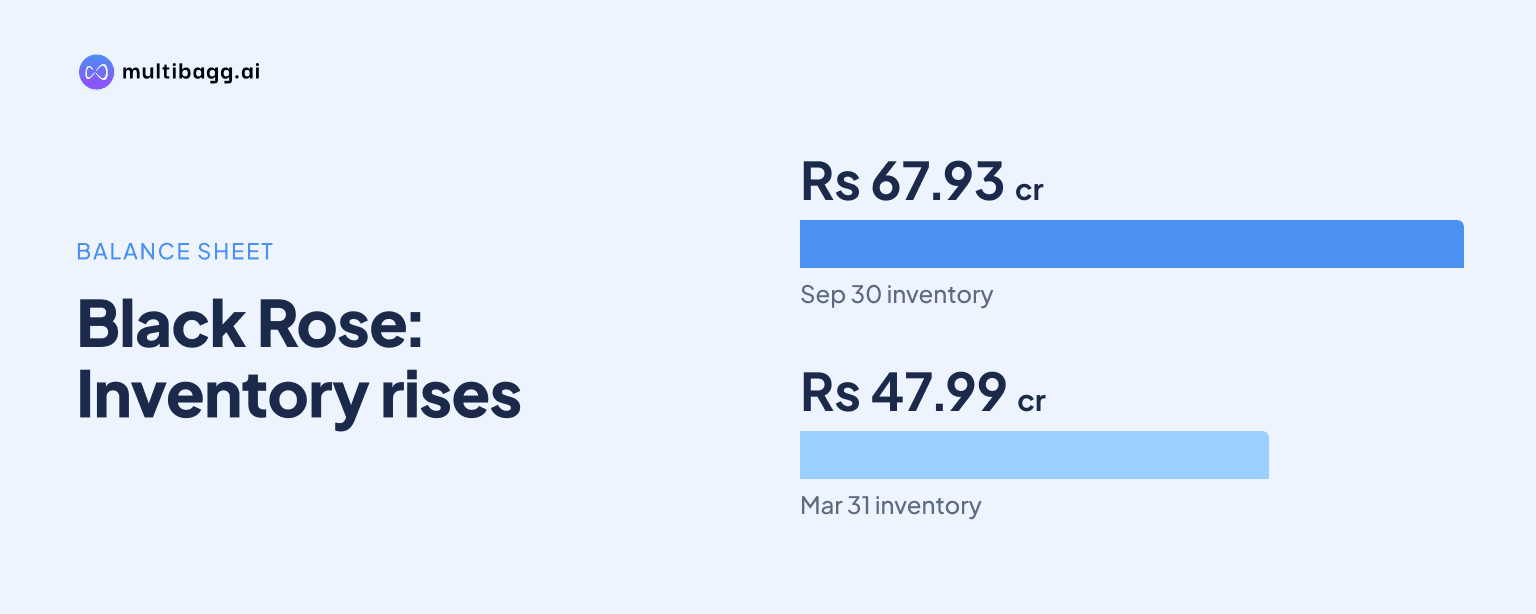
Black Rose Industries Limited reported standalone inventory of Rs 67.93 crore at September 30, 2026, 42% above Rs 47.99 crore at March 31, while trade payables to creditors other than micro and small enterprises rose 87% to Rs 46.74 crore. Its cash-flow statement recorded a Rs 26.25 crore increase in payables, provisions and other liabilities during the half year.
Know Black Rose Industries inside out
Results, valuation, peers and who's buying, in one view.
How did Black Rose Industries’ inventory and payables change?
Black Rose Industries’ inventory increased by Rs 19.94 crore over the six months ended September 30, 2026, reaching Rs 67.93 crore from Rs 47.99 crore at March 31, 2026. The standalone balance sheet therefore shows a 42% rise in stock held. Black Rose Industries reports a single primary business segment, chemicals, and does not disclose stock categories or product-level reasons for the inventory increase.
Trade payables to creditors other than micro enterprises and small enterprises increased by Rs 21.80 crore to Rs 46.74 crore at September 30 from Rs 24.94 crore at March 31. That 87% increase exceeded the Rs 19.94 crore rise in the inventory balance. The March 31 balance sheet separately reported Rs 11.88 lakh due to micro enterprises and small enterprises, while no September 30 amount is shown for that line in the supplied statement.
The balance-sheet comparison shows that supplier obligations rose faster than inventory in percentage terms over the six months. It does not establish that a particular supplier payment term or payable directly funded a particular inventory purchase. Current borrowings increased from Rs 14.91 lakh at March 31 to Rs 29 lakh at September 30, and the statement does not show a non-current borrowing amount at either date.
What does Black Rose Industries’ cash flow show?
Black Rose Industries recorded a Rs 19.94 crore outflow for the increase in inventories in its standalone cash-flow statement for the half year ended September 30, 2026. This was marginally higher than the Rs 19.94 crore increase calculated from the two balance-sheet dates because the cash-flow adjustment was Rs 19.9361 crore before conversion and the balance-sheet movement was Rs 19.9359 crore. The supplied filing provides no reconciliation for the difference.
The same cash-flow statement recorded a Rs 26.25 crore increase in payables, provisions and other liabilities. This is a broader category than the Rs 21.80 crore balance-sheet increase in trade payables to other creditors, because it also includes provisions and other liabilities. Other financial liabilities rose by Rs 3.23 crore, other current liabilities by Rs 1.20 crore and current tax liabilities by Rs 2.32 crore between March 31 and September 30.
Before working-capital changes, operating profit was Rs 33.14 crore for the half year. A Rs 1.92 crore decrease in receivables and other assets, together with the Rs 26.25 crore increase in payables, provisions and other liabilities, more than offset the inventory outflow. After Rs 5.71 crore of net direct taxes, net cash flow from operating activities was Rs 35.66 crore.
Got a follow-up? Ask IRIS
Did bank borrowing materially change during the half year?
Black Rose Industries reported Rs 14.09 lakh of net proceeds from short-term bank borrowings in the half year ended September 30, 2026. Its current-borrowing balance moved by the same Rs 14.09 lakh, from Rs 14.91 lakh at March 31 to Rs 29 lakh at September 30. That reported increase was smaller than the Rs 26.25 crore cash-flow movement in payables, provisions and other liabilities, although the latter category is not limited to bank funding or trade payables.
Financing activities used Rs 16.82 crore of cash during the six months, including Rs 16.58 crore in dividends paid. Interest paid was Rs 35.53 lakh and repayment of operating lease liabilities was Rs 3.40 lakh. Cash and cash equivalents fell by Rs 1.35 crore to Rs 1.58 crore at September 30, from Rs 2.93 crore at the beginning of the period.
Investing activities used Rs 20.18 crore during the half year, including Rs 50.56 crore spent purchasing mutual funds and Rs 34.22 crore received from selling them. Purchases of property, plant and equipment, capital work-in-progress and intangible assets under development totalled Rs 3.22 crore. Current investments on the September 30 balance sheet were Rs 37.62 crore, compared with Rs 20.01 crore at March 31.
How did inventory move alongside revenue and profit?
Black Rose Industries reported standalone revenue from operations of Rs 176.76 crore for the half year ended September 30, 2026, compared with Rs 143.83 crore in the corresponding half year ended September 30, 2025. Purchase of stock-in-trade rose to Rs 91.42 crore from Rs 74.58 crore, while cost of materials consumed increased to Rs 41.18 crore from Rs 34.90 crore. The filing does not link these expense lines to individual stock categories.
The profit-and-loss line for changes in inventories of finished goods, work-in-progress and traded goods was negative Rs 11.59 crore for the 2026 half year, compared with positive Rs 3.28 crore a year earlier. This line is an expense calculation for the period, rather than a restatement of closing inventory on the balance sheet. It coincided with the Rs 19.94 crore increase in closing inventory at September 30.
Profit before tax rose to Rs 28.43 crore in the 2026 half year from Rs 11.88 crore a year earlier, while net profit after tax increased to Rs 20.89 crore from Rs 8.67 crore. Finance costs declined to Rs 43.83 lakh from Rs 71.46 lakh in the corresponding period. The results were approved by Black Rose Industries’ board on November 6, 2026, and were subject to an independent limited review.
Conclusion
The September 30, 2026 standalone statements show a larger working-capital position at Black Rose Industries. Inventory increased by Rs 19.94 crore and trade payables to other creditors increased by Rs 21.80 crore, while the broader cash-flow category of payables, provisions and other liabilities rose by Rs 26.25 crore. Those changes contributed to Rs 35.66 crore of operating cash flow despite the inventory outflow.
The next reported balance sheet will show whether inventory, trade payables and cash continue to move together after September 30. The filing disclosed Rs 1.58 crore in cash and cash equivalents, Rs 37.62 crore in current investments and Rs 16.58 crore of dividends paid during the half year, but it did not disclose a working-capital target, inventory-reduction plan or payment schedule for supplier obligations.