










Bombay Burmah Trading Corporation Q2 FY26 Revenue Rises 3.9%
Key highlights
- Bombay Burmah Trading Corporation reported Q2 FY26 total income of ₹5,024.27 crore, up 3.9% year on year.
- Revenue from operations rose to ₹4,942.83 crore in Q2 FY26 from ₹4,760.84 crore a year earlier.
- Q2 FY26 EPS declined to ₹34.64 from ₹36.22 in Q2 FY25.
- FY26 operating cash flow was ₹2,417.50 crore, compared with ₹2,277.51 crore in FY25.
powered by IRIS
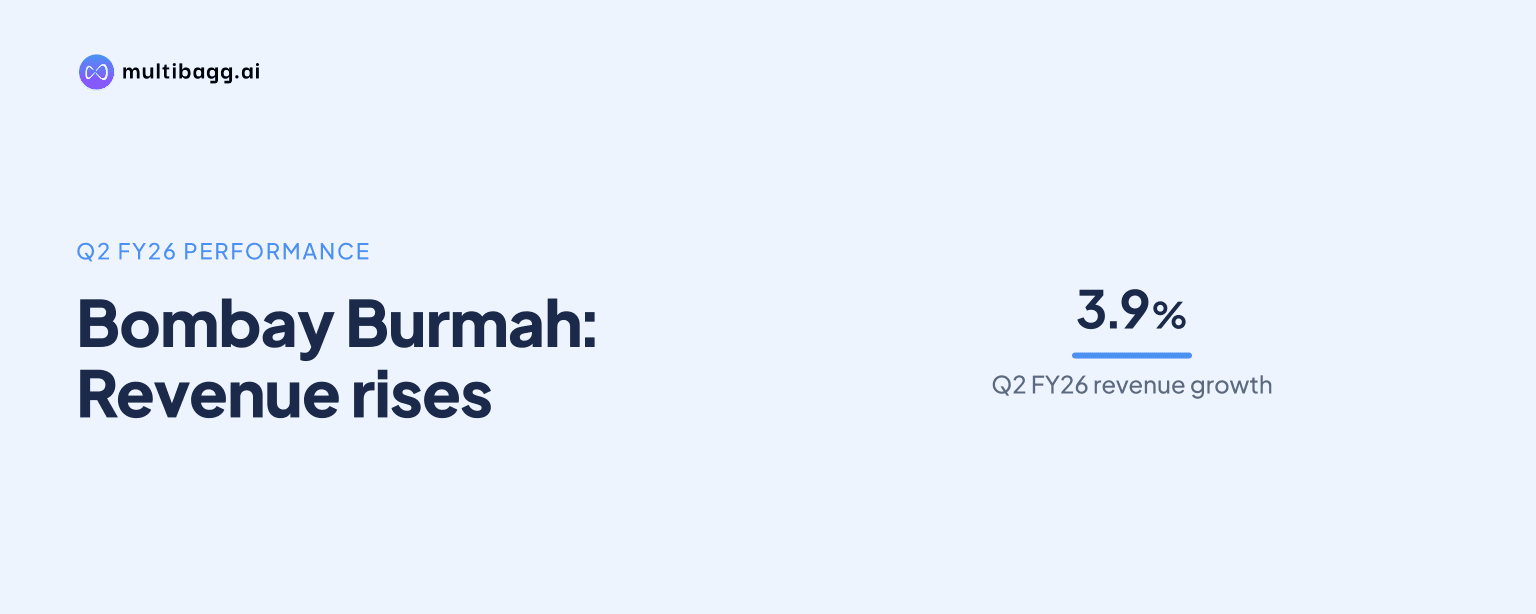
Bombay Burmah Trading Corporation Ltd reported Q2 FY26 total income of ₹5,024.27 crore, up 3.9% year on year, while earnings per share fell to ₹34.64 from ₹36.22. The result paired revenue growth with mixed profitability indicators in the supplied financial summaries, making the reported measure used especially relevant for investors.
Know The Bombay Burmah Trading Corporation inside out
Results, valuation, peers and who's buying, in one view.
How did Bombay Burmah perform in Q2 FY26?
Bombay Burmah reported total income of ₹5,024.27 crore for the quarter ended September 30, 2025, compared with ₹4,784.20 crore in the preceding June quarter. The supplied result summary described this as a 5.0% sequential increase and 3.9% year-on-year growth. Revenue from operations was reported at ₹4,942.83 crore, versus ₹4,760.84 crore a year earlier.
The company announced the Q2 FY26 result on November 14, 2025. The quarterly financial table also showed operating profit of ₹938.66 crore and EBITDA of ₹1,020.10 crore for the September quarter. These numbers indicate that operating earnings increased from the June quarter, when operating profit stood at ₹724.19 crore and EBITDA was ₹796.48 crore.
What happened to earnings and costs during the quarter?
Earnings per share declined 4.4% year on year to ₹34.64 from ₹36.22, according to the supplied second-quarter summary. This fall came despite the increase in income, showing that the rise in sales did not translate uniformly into per-share earnings.
The supplied material contains different profit figures for the same period and should therefore be read carefully. The quarterly table lists profit and loss for the year at ₹565.23 crore and reported PAT at ₹568.36 crore for the September quarter. A separate result summary reports consolidated PAT of ₹241.68 crore, down from ₹252.71 crore a year earlier. It also cites Q2 expenses of ₹4,137 crore, while another summary gives total expenses of ₹4,352.83 crore. The material does not explain the basis for these differences.
Cost pressures were visible in another set of supplied figures. Cost of materials consumed was stated at ₹2,837.97 crore, up 12.46% year on year, and employee benefits expense was ₹237.95 crore, up 12.76%. Investors comparing quarterly profitability should therefore distinguish between the detailed table and the separate summaries rather than treating all disclosed profit figures as directly comparable.
What businesses support Bombay Burmah's operations?
Bombay Burmah operates across tea and coffee plantations, auto electric components, healthcare and real estate in India and international markets. This diversified structure means that its consolidated performance is shaped by several operating businesses rather than a single commodity or end market.
The company was established in 1863 and is described in the supplied material as one of India's oldest business entities. It began as the flagship of the Wadia Group, with origins in teak trading before expanding into South Indian tea plantations. Its long operating history and multi-sector portfolio provide context for why group-level income and profit can be affected by varied business conditions.
The article data does not provide segment-wise revenue, margins or management commentary for Q2 FY26. As a result, it is not possible from the supplied information to quantify the contribution of plantations, auto components, healthcare or real estate to the quarter's growth.
Got a follow-up? Ask IRIS
How did the quarter affect investors and the market?
For investors, the principal takeaway was a combination of higher revenue and lower EPS. The reported 3.9% year-on-year increase in total income and 5.0% quarter-on-quarter rise indicate continuing top-line momentum, but the decline in EPS points to a less favourable per-share outcome than in the prior-year quarter.
The supplied material states that Bombay Burmah's share price edged up 0.07% to ₹1,491.40 following a results update. It also reports a 25.38% fall in net profit to ₹582.67 crore in a separate comparison, which differs from other profit figures provided. Given these inconsistencies, the limited reported price movement should not be interpreted as a conclusive assessment of the quarter by the market.
For operations, higher material and employee costs are relevant because these can affect margins if revenue growth does not sufficiently offset them. The reported increase in operating profit and EBITDA in the quarterly table suggests improved operating earnings versus the June quarter, although the supplied information does not provide a complete reconciliation of all profitability measures.
What longer-term financial indicators were reported?
For the trailing twelve months ended FY26, the supplied data puts revenue from operations at ₹19,241.05 crore, up 7.57% from the previous trailing period. Net profit was reported at ₹2,499.25 crore, an increase of 13.64%, while profit before tax rose 9.63% to ₹3,350.93 crore.
The company also reported consolidated net cash flow from operating activities of ₹2,417.50 crore in FY26, compared with ₹2,277.51 crore in FY25. Operating cash generation is a separate measure from accounting profit and provides additional context on cash produced by the group's business operations over the full year.
No official Q2 FY27 results date had been announced by Bombay Burmah in the supplied information. The next reported quarterly disclosure will be important for assessing whether revenue growth, cost movements and the various profit measures become clearer on a like-for-like basis.
Conclusion
Bombay Burmah's Q2 FY26 data showed year-on-year income growth, with total income reaching ₹5,024.27 crore and revenue from operations at ₹4,942.83 crore. However, EPS declined to ₹34.64, while the supplied material presents differing PAT, expense and EBITDA figures. The revenue trend is clear, but profitability comparisons require attention to the reporting basis used.
Investors should watch for Bombay Burmah's next official quarterly announcement, particularly its Q2 FY27 schedule, once disclosed. Further updates on operating costs, segment-level performance and a consistent reconciliation of profit measures would help assess whether the group's revenue growth is being converted into sustainable earnings and cash flow.