










Brightcom Group Ltd reports 17.4% Q2 revenue growth in FY27
Key highlights
- Brightcom Group Ltd reported Q2 FY27 revenue of Rs 1,937.04 crore, up 17.38% year on year.
- Brightcom Group Ltd reported Q2 FY27 PAT of Rs 264.96 crore, up 13.70% year on year.
- Brightcom Group Ltd reported H1 FY27 revenue of Rs 3,689.21 crore and PAT of Rs 526.54 crore.
- Brightcom Group Ltd's annual revenue increased from Rs 4,662 crore in FY24 to Rs 6,928 crore in FY26.
powered by IRIS
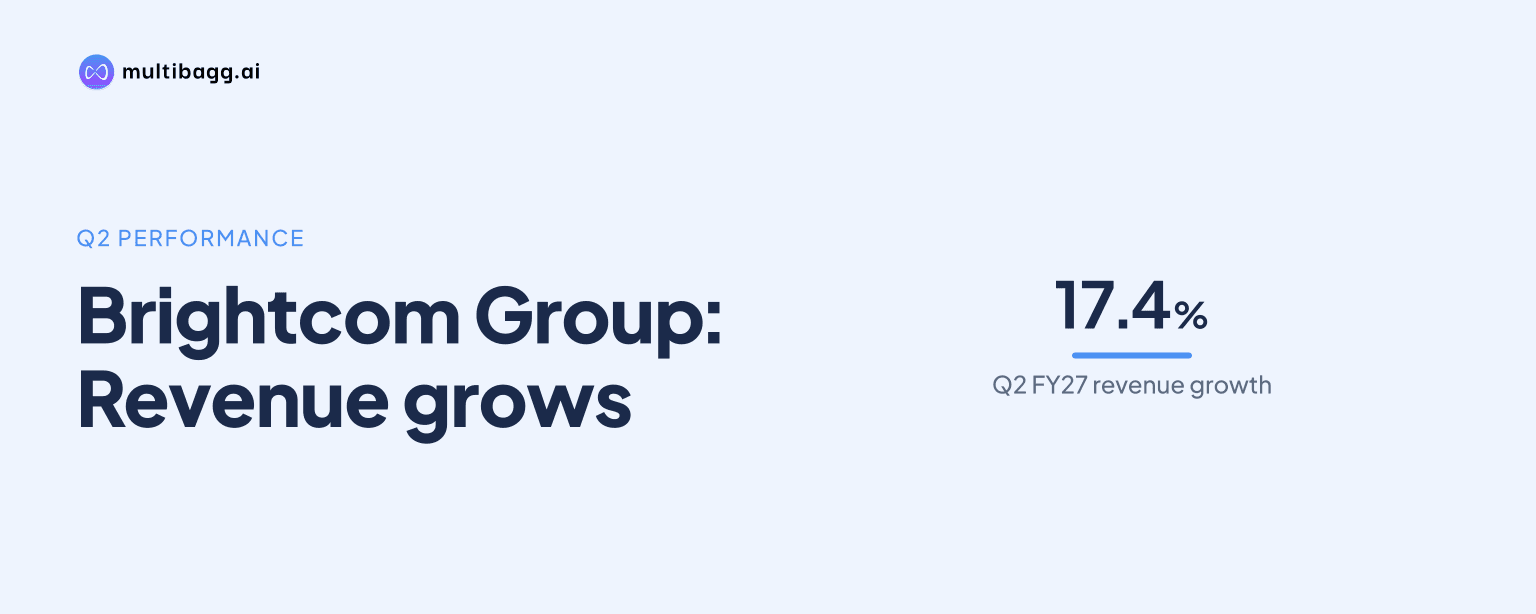
Brightcom Group Ltd reported consolidated Q2 FY27 revenue of Rs 1,937.04 crore, up 17.38% year on year, while profit after tax, or PAT, rose 13.70% to Rs 264.96 crore. Brightcom reported Rs 3,689.21 crore of revenue and Rs 526.54 crore of PAT for the six months ended 30 September 2026.
Know Brightcom Group inside out
Results, valuation, peers and who's buying, in one view.
How did Brightcom perform in Q2 FY27?
Brightcom reported Q2 FY27 consolidated revenue of Rs 1,937.04 crore and PAT of Rs 264.96 crore. The company said revenue increased 17.38% over Q2 FY26 and PAT increased 13.70% over the same quarter. Its presentation also reported trailing 12-month, or TTM, earnings per share, or EPS, of Rs 5.18.
Revenue grew faster than PAT in the reported year-on-year comparison, by 3.68 percentage points. The presentation does not provide the Q2 FY26 revenue and PAT amounts, Q2 FY27 operating profit, tax expense, finance costs or a reason for the difference between the two growth rates.
Brightcom presents the Q2 result as a consolidated group figure across AdTech, Defence, NextGen and Services. It does not disclose Q2 FY27 revenue, PAT or operating metrics by division, so the presentation does not establish which business contributed to the Rs 1,937.04 crore quarterly revenue.
What were Brightcom's H1 FY27 results?
Brightcom reported H1 FY27 revenue of Rs 3,689.21 crore and PAT of Rs 526.54 crore for the six months ended 30 September 2026. These consolidated figures include Q2 FY27 revenue of Rs 1,937.04 crore and PAT of Rs 264.96 crore.
Q2 revenue was more than half of the reported H1 revenue, while Q2 PAT was slightly more than half of H1 PAT. The presentation does not separately state Q1 FY27 revenue or PAT, although the half-year and Q2 totals show the relationship between the two reported periods.
Brightcom reports TTM EPS of Rs 5.18 beside the H1 FY27 snapshot, rather than a Q2 EPS figure. EPS is earnings per share, while PAT is the group profit measure; the presentation does not state the share count used for the TTM EPS calculation.
How has Brightcom's revenue progressed since FY24?
Brightcom's revenue increased from Rs 4,662 crore in FY24 to Rs 5,147 crore in FY25 and Rs 6,928 crore in FY26. It reported Rs 3,689.21 crore for H1 FY27, which is a six-month amount and not directly comparable with the three full-year figures.
Annual revenue rose by Rs 485 crore from FY24 to FY25, then by Rs 1,781 crore from FY25 to FY26. Across FY24 to FY26, revenue increased by Rs 2,266 crore, while the presentation provides no FY27 full-year revenue target or guidance.
Brightcom describes H1 FY27 as current-year momentum, but does not provide a divisional split for the Rs 3,689.21 crore revenue. The table therefore records group-level progression rather than the contribution from AdTech, Defence, NextGen or Services.
Got a follow-up? Ask IRIS
What does Brightcom's profit progression show?
Brightcom's PAT rose from Rs 688 crore in FY24 to Rs 710 crore in FY25 and Rs 962 crore in FY26, before reaching Rs 526.54 crore in H1 FY27. The annual increase was Rs 22 crore between FY24 and FY25, compared with Rs 252 crore between FY25 and FY26.
Brightcom's annual EPS increased from Rs 3.41 in FY24 to Rs 3.52 in FY25 and Rs 4.77 in FY26, while its reported TTM EPS was Rs 5.18. The TTM figure is a trailing 12-month measure reported at 30 September 2026, not a forecast for FY27 earnings.
The presentation reports Q2 FY27 PAT growth of 13.70%, but does not provide cash flow, debt, margin or working-capital figures for Q2 or H1 FY27. It also does not offer management commentary on the cost, tax or financing factors behind the profit result.
What business structure supports Brightcom's consolidated results?
Brightcom says it operates through four focused divisions: AdTech, Defence, NextGen and Services. The company dates its digital beginnings to 1998 and says Brightcom Defence was launched in 2025, while its Q2 FY27 revenue of Rs 1,937.04 crore is reported on a consolidated basis.
Brightcom identifies operations across Canada, the United States, Europe, Asia, Israel, South America and Australia. No revenue, PAT, customer, contract or asset figure is allocated to any geography or division for the six months ended 30 September 2026.
The board page identifies M. Suresh Kumar Reddy as Chairman, Managing Director and chief executive officer, and Raghunath Alamsetty as Executive Director. That disclosure accompanies the H1 FY27 consolidated PAT of Rs 526.54 crore, but the presentation gives no management outlook, financial target or future reporting date.
Conclusion
Brightcom's presentation shows continued consolidated growth in Q2 FY27, with revenue of Rs 1,937.04 crore rising 17.38% year on year and PAT of Rs 264.96 crore rising 13.70%. The longer series also shows annual revenue increasing from Rs 4,662 crore in FY24 to Rs 6,928 crore in FY26, while annual PAT increased from Rs 688 crore to Rs 962 crore.
The next issue to watch is whether later FY2027 disclosures add the information absent from the presentation, particularly a full-year target, divisional financial results and explanations for the relationship between revenue growth and PAT growth. Brightcom has disclosed H1 FY27 revenue of Rs 3,689.21 crore and PAT of Rs 526.54 crore, but not guidance for the remainder of FY2027.