










CLN Energy revenue rises 13% but September-half profit falls
Key highlights
- CLN Energy’s September 2026 standalone revenue from operations rose 13% to Rs 172.16 crore.
- CLN Energy’s standalone net profit fell 15% to Rs 7.33 crore from Rs 8.57 crore.
- CLN Energy’s basic and diluted EPS declined to Rs 6.94 from Rs 8.12.
- CLN Energy’s cash and cash equivalents increased to Rs 38.22 crore at September 30, 2026 from Rs 30.25 crore at March 31, 2026.
powered by IRIS
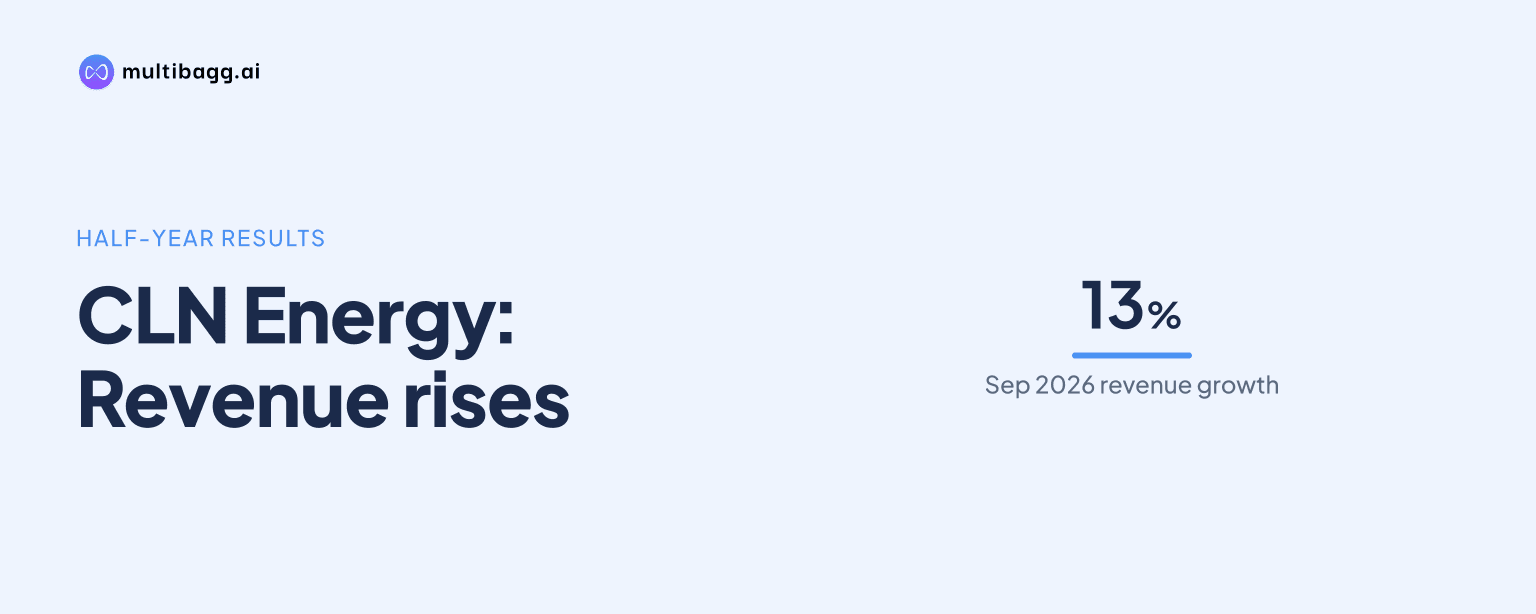
CLN Energy Limited reported standalone revenue from operations of Rs 172.16 crore for the half year ended September 30, 2026, up 13% from a year earlier, while net profit fell 15% to Rs 7.33 crore from Rs 8.57 crore. Earnings per share declined to Rs 6.94 from Rs 8.12 despite the higher sales base.
Know CLN Energy inside out
Results, valuation, peers and who's buying, in one view.
Why did CLN Energy’s profit decline despite revenue growth?
CLN Energy’s standalone net profit declined even as revenue rose because the filing shows profit after tax of Rs 7.33 crore for the September 2026 half year, compared with Rs 8.57 crore a year earlier. Revenue from operations increased by Rs 20.16 crore from Rs 152.00 crore, while profit decreased by Rs 1.24 crore. The statement reports no exceptional items in either half-year comparison.
Profit before tax rose to Rs 11.50 crore from Rs 10.69 crore, an increase of about 8%, contrasting with the movement in reported net profit. The financial statement separately presents current tax, minimum alternate tax credit and deferred-tax items, but its extracted tabular format does not provide a sufficiently clear comparable total tax-expense line. The disclosed figures nevertheless show that the increase in pre-tax profit did not result in higher after-tax profit.
The September 2026 result was also below the immediately preceding half year ended March 31, 2026, when CLN Energy reported revenue from operations of Rs 193.96 crore and net profit of Rs 11.99 crore. Revenue was Rs 21.80 crore lower sequentially and net profit was lower by Rs 4.66 crore. The March 2026 half-year figure is the balancing figure between the audited full-year result and the September 2025 half-year result, as stated in the notes.
How did CLN Energy’s September-half earnings compare year on year?
CLN Energy reported higher operating and total revenue year on year, but lower net profit and earnings per share. Total revenue, including other income, reached Rs 174.31 crore in the half year ended September 30, 2026, compared with Rs 152.00 crore in the corresponding 2025 period. Other income more than doubled to Rs 1.85 crore from Rs 0.90 crore.
CLN Energy’s paid-up equity share capital was Rs 10.55 crore at September 30, 2026, unchanged from the year-earlier half-year figure and from March 31, 2026. The face value was Rs 10 per equity share. Basic and diluted earnings per share, or EPS, were both Rs 6.94 for September 2026; the filing says half-year EPS is not annualised.
What changed in CLN Energy’s balance sheet?
CLN Energy’s standalone total assets rose to Rs 327.96 crore at September 30, 2026 from Rs 254.88 crore at March 31, 2026. Current assets increased to Rs 305.33 crore from Rs 228.85 crore, while non-current assets declined to Rs 22.63 crore from Rs 26.03 crore over the six-month period.
Inventories increased by Rs 17.00 crore to Rs 82.61 crore, and short-term loans and advances rose by Rs 62.04 crore to Rs 95.73 crore. Trade receivables moved in the opposite direction, declining by Rs 10.70 crore to Rs 86.27 crore from Rs 96.98 crore at the March 2026 year-end. Cash and cash equivalents were Rs 38.22 crore, compared with Rs 30.25 crore at March 31.
Total equity rose to Rs 122.37 crore from Rs 115.05 crore, as reserves and surplus increased to Rs 111.82 crore from Rs 104.50 crore. Non-current liabilities increased to Rs 18.67 crore from Rs 1.28 crore, including long-term borrowings of Rs 15.77 crore where no such balance was reported at March 31, 2026.
Current liabilities rose to Rs 186.92 crore from Rs 138.55 crore. Current borrowings increased to Rs 128.62 crore from Rs 93.27 crore, while other current liabilities increased to Rs 13.21 crore from Rs 4.72 crore. Trade-payable dues to micro enterprises and small enterprises stood at Rs 6.05 crore, against Rs 4.24 crore at the March year-end.
Got a follow-up? Ask IRIS
What does CLN Energy’s cash flow statement show?
CLN Energy reported net cash used in operating activities of Rs 39.72 crore during the half year ended September 30, 2026. This followed operating profit before working-capital changes of Rs 19.52 crore, but working-capital movements reduced cash generated from operations to negative Rs 39.72 crore. The filing records no taxes paid for the period.
The largest stated working-capital movement was Rs 62.04 crore in short-term loans and advances, while inventory movement was Rs 17.00 crore. A Rs 10.70 crore movement in trade receivables and Rs 8.50 crore movement in other current liabilities partly offset those uses of cash. The cash flow statement also records a Rs 0.41 crore movement in trade payables.
Financing activities generated Rs 45.75 crore, including Rs 15.77 crore of proceeds from long-term borrowings and Rs 35.35 crore from short-term borrowings. Finance costs of Rs 5.37 crore were deducted in that section. Investing activities generated Rs 1.95 crore, reflecting fixed-deposit movements and Rs 1.27 crore of interest income, partly offset by Rs 0.67 crore spent on property, plant and equipment.
Cash and cash equivalents consequently increased by Rs 7.97 crore to Rs 38.22 crore at September 30, 2026. Fixed deposits accounted for Rs 37.69 crore of the closing amount, bank balances were Rs 0.51 crore and cash in hand was Rs 1.52 lakh. The statement reports a closing cash-equivalent balance of Rs 30.25 crore at March 31, 2026.
What did CLN Energy disclose about employee stock options?
CLN Energy disclosed an approved pool of up to 12,36,000 employee stock options, approved by its board on July 3, 2025, subject to the cited approvals, vesting conditions and regulatory requirements. The options are convertible into an equivalent number of equity shares under the employee stock option plan, or ESOP.
The Nomination and Remuneration Committee or board proposed a grant of 1,60,046 options under the ESOP Scheme approved on January 29, 2026. After accounting for options that lapsed or were forfeited following employee departures, 1,31,702 options remained available for future grants at September 30, 2026.
The September-half standalone results were unaudited and approved by CLN Energy’s board on November 14, 2026. The independent auditor’s limited-review report said nothing had come to its attention that would indicate a material misstatement in the standalone financial results. It also said a review is substantially narrower in scope than an audit.
Conclusion
CLN Energy’s September-half results show a divergence between sales and earnings: standalone revenue from operations rose 13% to Rs 172.16 crore and profit before tax increased to Rs 11.50 crore, but net profit fell 15% to Rs 7.33 crore. Higher inventories and short-term loans and advances coincided with a Rs 39.72 crore operating cash outflow, while borrowings increased.
The next disclosed matter to watch is the use of the ESOP pool, of which 1,31,702 options were available for future grants at September 30, 2026. The company also reported Rs 15.77 crore of long-term borrowings and Rs 35.35 crore of short-term borrowing proceeds during the half year, leaving future reporting to show how these funding movements and working-capital balances develop.