










DBL H1 FY27 profit fell 53% as exceptional items declined
Key highlights
- DBL’s H1FY27 consolidated profit after tax fell 53% to Rs 229 crore from Rs 486 crore.
- H1FY27 consolidated revenue rose 2% to Rs 4,628 crore, while EBITDA margin declined to 18.76% from 21.81%.
- Exceptional items decreased to Rs 2 crore in H1FY27 from Rs 292 crore in H1FY26.
- Working-capital days fell to 130 at September 2026 from 133 at June 2026, while net debt to equity remained 0.31 times.
powered by IRIS
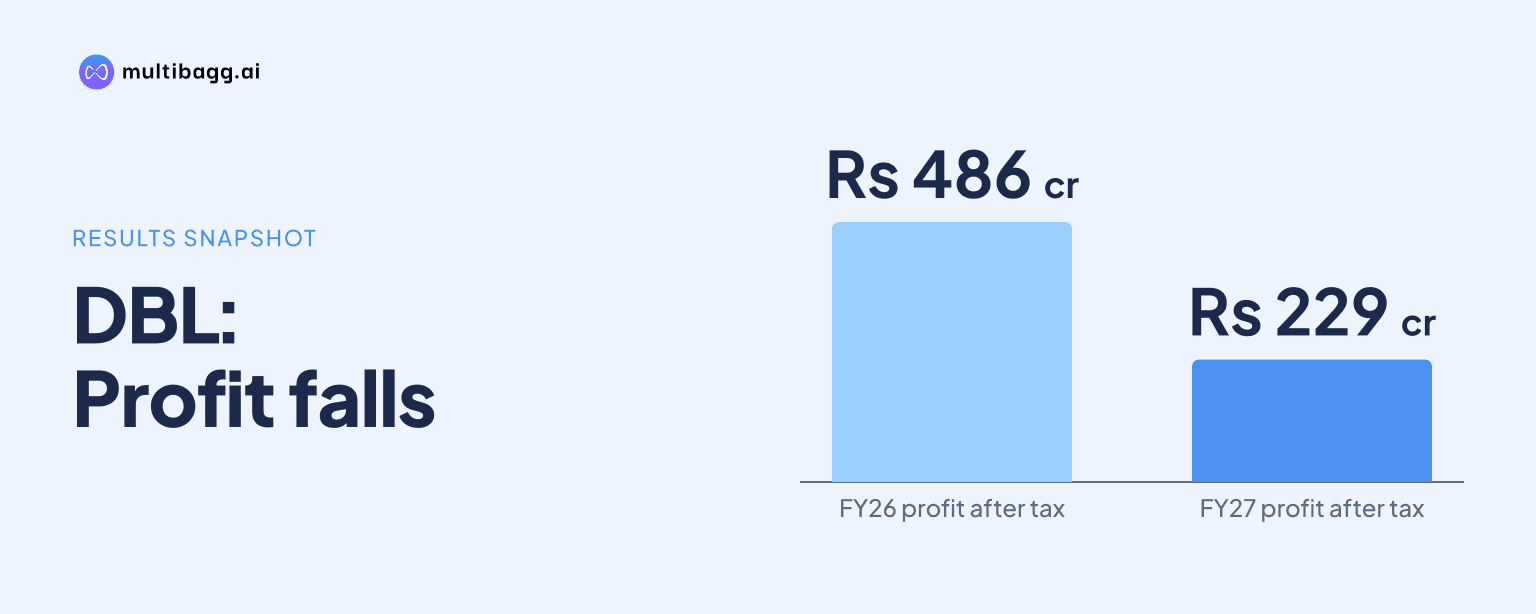
DBL reported consolidated profit after tax of Rs 229 crore in H1FY27, down 53% from Rs 486 crore in H1FY26, despite revenue rising 2% to Rs 4,628 crore. Exceptional items fell to Rs 2 crore from Rs 292 crore, while earnings before interest, tax, depreciation and amortisation margin narrowed to 18.76% from 21.81%.
Know Dilip Buildcon inside out
Results, valuation, peers and who's buying, in one view.
Why did DBL’s H1FY27 consolidated profit decline?
DBL’s H1FY27 consolidated profit declined primarily because exceptional items reduced to Rs 2 crore from Rs 292 crore a year earlier. Profit before tax fell 44% to Rs 335 crore from Rs 595 crore, although profit before exceptional items and tax increased 10% to Rs 334 crore from Rs 304 crore.
Operating performance also declined in the half year. Earnings before interest, tax, depreciation and amortisation, or EBITDA, excluding other income, fell 12% to Rs 868 crore in H1FY27 from Rs 991 crore in H1FY26. Other income decreased 62% to Rs 109 crore from Rs 285 crore, while tax expense was Rs 106 crore compared with Rs 110 crore in the earlier half year.
The contrast between reported and pre-exceptional profit is material. Profit before exceptional items and tax rose by Rs 30 crore in H1FY27, but the Rs 290 crore reduction in exceptional items contributed to the Rs 257 crore fall in reported profit after tax.
How did DBL’s revenue and margins change in H1FY27?
DBL’s consolidated revenue increased 2% to Rs 4,628 crore in H1FY27, while EBITDA margin fell by 3.05 percentage points to 18.76%. Operating expenses rose 6% to Rs 3,760 crore from Rs 3,555 crore, exceeding the Rs 82 crore increase in revenue and reducing EBITDA by Rs 123 crore.
The H1FY27 EBITDA margin was also below the 19.65% reported for FY26. Consolidated profit-after-tax margin decreased to 4.95% from 10.68% in H1FY26, a 5.73-percentage-point reduction that reflects both lower EBITDA and the much smaller exceptional-item contribution.
Q2FY27 showed a sequential improvement in operating margin. Revenue was Rs 2,250 crore, down 5% from Rs 2,378 crore in Q1FY27, while EBITDA increased 2% to Rs 439 crore from Rs 429 crore. The EBITDA margin consequently rose to 19.50% from 18.06% in Q1FY27, though it remained below 24.45% in Q2FY26.
Consolidated Q2FY27 profit after tax was Rs 101 crore, down 53% from Rs 214 crore in Q2FY26 and 21% below Rs 128 crore in Q1FY27. However, Q2FY27 profit before exceptional items and tax was Rs 176 crore, above Rs 142 crore in Q2FY26, when exceptional items were Rs 122 crore versus Rs 2 crore in Q2FY27.
Got a follow-up? Ask IRIS
What changed in DBL’s working capital during H1FY27?
DBL’s working-capital days declined to 130 at September 2026 from 133 at June 2026, but remained above 114 days at September 2025. Debtor days reduced to 105 from 107 and inventory days fell to 162 from 171 during the June-to-September 2026 quarter, while creditor days decreased to 136 from 145.
The year-on-year comparison shows the duration of funds tied up in working capital remained higher. At September 2026, debtor days were 37 days above September 2025’s 68 days, and inventory days were 13 days above 149 days. Creditor days were also 33 days higher than the 103 days reported a year earlier.
DBL’s standalone cash flow statement provides context for the H1 Sep-26 position. Operating profit before working-capital changes was Rs 471 crore, but a Rs 637 crore increase in current and non-current assets was partly offset by a Rs 271 crore increase in liabilities. Cash generated from operations was Rs 105 crore and net cash generated from operating activities was Rs 136 crore after a Rs 31 crore income-tax refund.
What does DBL’s September 2026 debt position show?
DBL’s net-debt-to-equity ratio was unchanged at 0.31 times at September 2026 compared with June 2026. Net debt increased by Rs 40 crore to Rs 2,146 crore, while equity rose by Rs 35 crore to Rs 6,908 crore from Rs 6,873 crore.
The ratio was 0.28 times at March 2026 and 0.35 times at September 2025. Working-capital debt to equity declined to 0.26 times at September 2026 from 0.27 times in June 2026, while equipment debt to equity increased to 0.05 times from 0.04 times.
DBL’s standalone balance sheet recorded total borrowings of Rs 2,522 crore at September 30, 2026, comprising Rs 276 crore of non-current borrowings and Rs 2,246 crore of current borrowings. At March 31, 2026, non-current borrowings were Rs 110 crore and current borrowings were Rs 2,168 crore, while total standalone equity increased to Rs 6,908 crore from Rs 6,823 crore.
Standalone interest paid was Rs 214 crore in H1 Sep-26, equal to the interest expense in the standalone income statement. Net cash used in investing activities was Rs 197 crore, including Rs 177 crore spent on investment purchases, and total net cash flow was an outflow of Rs 47 crore for the half year.
Conclusion
DBL’s H1FY27 results show that revenue growth of 2% did not offset lower operating profitability and the absence of the prior year’s exceptional-item contribution. EBITDA fell 12%, margin declined to 18.76%, and reported profit after tax fell to Rs 229 crore, even as profit before exceptional items and tax rose to Rs 334 crore.
The next disclosed developments to watch are working-capital days after the September 2026 reduction to 130 days and DBL’s planned project divestments. The presentation states that DBL and Alpha Alternative’s combined 100% shareholding in four completed hybrid annuity model projects is to be divested to Anantam Highways InvIT in December 2026, followed by four further projects scheduled for September 2027.