










Dynacons workforce revenue falls 36% as integration rises
Key highlights
- Technology Workforce Augmentation Services revenue fell 36.4% year on year to Rs 3.55 crore in the quarter ended September 30, 2026.
- System Integration revenue rose 58.0% year on year to Rs 547.81 crore in the September 2026 quarter.
- System Integration generated Rs 52.92 crore, or 96.9%, of the two segments’ combined Rs 54.58 crore quarterly result.
- Dynacons reported September-quarter profit after tax of Rs 29.81 crore, up from Rs 22.68 crore a year earlier.
powered by IRIS
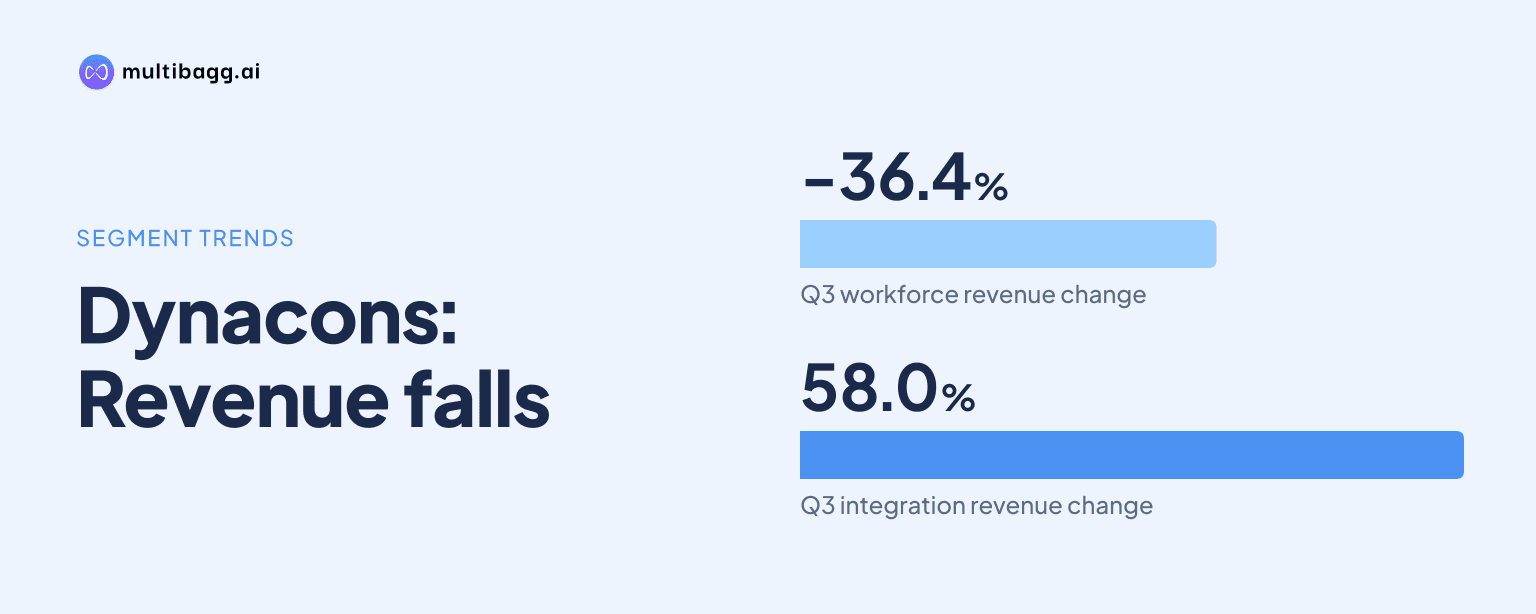
Dynacons Systems & Solutions Limited reported Technology Workforce Augmentation Services revenue of Rs 3.55 crore for the quarter ended September 30, 2026, down 36% year on year, while System Integration revenue rose 58% to Rs 547.81 crore. System Integration also contributed Rs 52.92 crore of the two segments’ combined Rs 54.58 crore result.
Know Dynacons Systems & Solutions inside out
Results, valuation, peers and who's buying, in one view.
Why did Dynacons’ workforce-augmentation revenue fall in September 2026?
Dynacons’ Technology Workforce Augmentation Services revenue was Rs 3.55 crore in the quarter ended September 30, 2026, compared with Rs 5.58 crore in the quarter ended September 30, 2025. That was a decline of Rs 2.03 crore, or 36.4%, based on the restated comparative segment figures. The filing identifies the decline but gives no operational explanation involving customers, contracts, staffing or pricing.
The September-quarter figure was nevertheless above the Rs 3.08 crore reported in the quarter ended June 30, 2026. That sequential increase of Rs 0.47 crore, or 15.3%, did not offset the year-on-year reduction. For the half year ended September 30, 2026, Technology Workforce Augmentation Services revenue was Rs 6.63 crore, against Rs 9.46 crore a year earlier, a reduction of Rs 2.83 crore.
Dynacons reported annual Technology Workforce Augmentation Services revenue of Rs 17.00 crore for the year ended March 31, 2026. The September 2026 half-year revenue of Rs 6.63 crore was therefore below both the corresponding half-year figure of Rs 9.46 crore and half of the prior full-year amount. The company identifies this activity and System Integration as its operating segments for reporting purposes.
How did System Integration drive Dynacons’ September-quarter growth?
System Integration drove Dynacons’ reported segment growth, with revenue rising by Rs 200.99 crore, or 58.0%, year on year to Rs 547.81 crore in the September 2026 quarter. It also rose by Rs 237.20 crore from Rs 310.61 crore in the June 2026 quarter. Those increases were substantially larger than the Rs 0.47 crore sequential increase in workforce-augmentation revenue.
The two listed segment-revenue figures add to Rs 551.36 crore for the September quarter, with System Integration representing 99.4% of that sum. Dynacons’ segment table separately prints total income from operations of Rs 591.36 crore for the same quarter. The printed total is Rs 40 crore above the sum of the two listed segment revenues, and the filing does not explain the difference.
For the half year ended September 30, 2026, System Integration revenue reached Rs 858.42 crore, up from Rs 671.79 crore in the corresponding 2025 period. The Rs 186.63 crore increase occurred while Technology Workforce Augmentation Services revenue fell by Rs 2.83 crore. The comparison shows that the reported revenue mix became more concentrated in System Integration during the six-month period.
How did Dynacons’ segment results and profit change?
System Integration produced a segment result of Rs 52.92 crore in the September 2026 quarter, compared with Rs 34.94 crore a year earlier and Rs 38.76 crore in the June 2026 quarter. The segment result increased by Rs 17.98 crore year on year and by Rs 14.16 crore sequentially. Technology Workforce Augmentation Services generated a segment result of Rs 1.67 crore, down from Rs 2.30 crore in September 2025.
The two segment results totalled Rs 54.58 crore in the September quarter, of which System Integration represented 96.9%. Workforce augmentation’s Rs 1.67 crore result was higher than Rs 1.43 crore in the June 2026 quarter, but lower by Rs 0.63 crore from the September 2025 quarter. The segment-result movement therefore followed the divergence shown in segment revenue.
Dynacons reported profit before tax of Rs 40.02 crore, compared with Rs 30.76 crore a year earlier, and profit after tax of Rs 29.81 crore, compared with Rs 22.68 crore. Finance costs increased to Rs 8.30 crore from Rs 5.06 crore, while unallocable expenses rose to Rs 8.09 crore from Rs 2.68 crore. Other income was Rs 1.62 crore, versus Rs 1.27 crore, and tax expense was Rs 10.20 crore.
Got a follow-up? Ask IRIS
Can Dynacons’ assets and liabilities be compared by segment?
No, Dynacons did not disclose segment assets or liabilities for System Integration and Technology Workforce Augmentation Services. The company said the assets and liabilities used in the business are used interchangeably between the reportable segments. Management said it was currently not practicable to provide total segment asset and liability disclosures.
That limitation means the September-quarter System Integration revenue of Rs 547.81 crore and workforce-augmentation revenue of Rs 3.55 crore cannot be compared with segment-specific asset bases, receivables, borrowings or liabilities. The filing supports comparisons of revenue and segment results, but not calculations of capital employed or balance-sheet exposure for either operating segment.
The consolidated cash-flow statement provides company-level figures rather than segment allocations. Net cash flow from operating activities was Rs 45.89 crore for the half year ended September 30, 2026, compared with Rs 9.74 crore for the corresponding 2025 period. Trade receivables increased by Rs 145.40 crore in the 2026 half year, but Dynacons did not assign that movement to either segment.
How were Dynacons’ segment figures prepared and approved?
Dynacons presented the two operating segments with its unaudited results for the quarter ended September 30, 2026, and said previous-period figures had been restated accordingly. The company prepared the results under Indian Accounting Standards, or Ind AS, notified under the Companies (Indian Accounting Standard) Rules, 2015 and the 2016 amendment rules.
The Audit Committee reviewed and recommended the results on November 14, 2026, and the board approved them on the same date. The restated September 2025 figures include Rs 346.82 crore of System Integration revenue and Rs 5.58 crore of Technology Workforce Augmentation Services revenue. Those comparative figures underpin the reported 58.0% System Integration increase and 36.4% workforce-augmentation decline.
Dynacons’ year ended March 31, 2026 segment figures also show the same reporting split, with System Integration revenue of Rs 1,407.29 crore and Technology Workforce Augmentation Services revenue of Rs 17.00 crore. The disclosed segment structure therefore separates the two activities in revenue and result reporting, while retaining a combined approach for assets and liabilities.
Conclusion
Dynacons’ September 2026 disclosure shows that the decline in Technology Workforce Augmentation Services did not prevent higher reported profit, because System Integration rose by Rs 200.99 crore in revenue and Rs 17.98 crore in segment result year on year. System Integration supplied 96.9% of the two segments’ combined Rs 54.58 crore quarterly result, while workforce augmentation contributed Rs 1.67 crore.
The next disclosure to watch is whether Dynacons resolves the Rs 40 crore difference between the printed total income from operations and the sum of its listed September-quarter segment revenues. Investors can also monitor whether the company changes its position that segment assets and liabilities are not practicable to disclose because they are used interchangeably between the two segments.