










Epigral EBITDA margin falls to 22% as returns decline in FY2026
Key highlights
- Epigral’s FY2026 EBITDA margin fell to 22% from 33% in FY2022, while revenue rose to Rs 2,542 crore from Rs 1,555 crore.
- FY2026 EBITDA declined by Rs 144 crore to Rs 567 crore from Rs 711 crore in FY2025.
- Gross margin decreased to 37% in FY2026 from 46% in FY2022, while gross profit reached Rs 941 crore.
- Epigral’s ROCE and ROE both fell to 16% in FY2026, while fixed assets increased by Rs 266 crore year over year to Rs 2,568 crore.
powered by IRIS
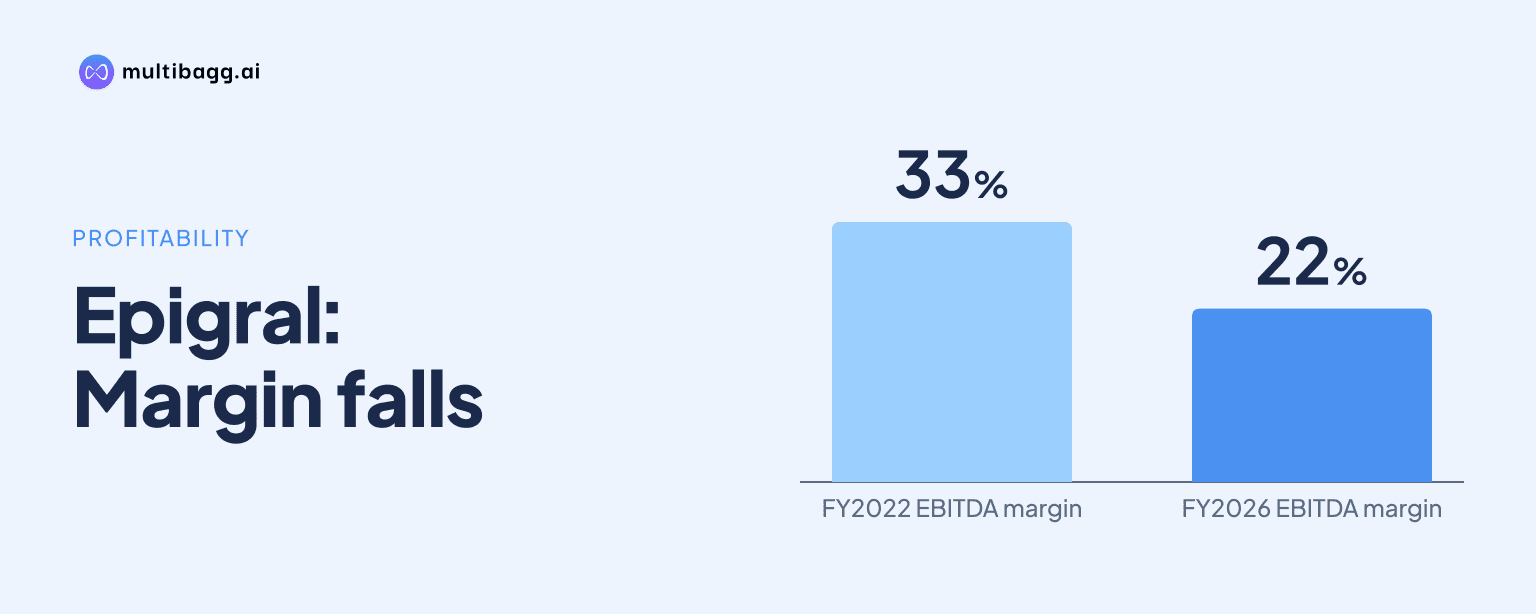
Epigral Limited’s EBITDA margin fell to 22% in FY2026 from 33% in FY2022, although revenue increased to Rs 2,542 crore from Rs 1,555 crore. Return on capital employed declined from 29% to 16%, while reported FY2026 profit after tax included an Rs 81 crore reduction in deferred tax liability after a tax-rate change.
Know Epigral inside out
Results, valuation, peers and who's buying, in one view.
How did Epigral’s EBITDA margin change from FY2022 to FY2026?
Epigral’s EBITDA margin declined by 11 percentage points over the five financial years, from 33% in FY2022 to 22% in FY2026. EBITDA, or earnings before interest, tax, depreciation and amortisation, increased from Rs 509 crore in FY2022 to Rs 567 crore in FY2026, but did not keep pace with revenue, which rose from Rs 1,555 crore to Rs 2,542 crore.
The movement was not a straight decline. EBITDA reached Rs 689 crore and the margin was 31% in FY2023, before the historic income statement reported EBITDA of Rs 481 crore and a 25% margin in FY2024. EBITDA then recovered to Rs 711 crore and the margin to 28% in FY2025, but FY2026 EBITDA was Rs 144 crore lower than in FY2025 and the margin was six percentage points lower.
Revenue in FY2026 was Rs 23 crore below the Rs 2,565 crore recorded in FY2025, while EBITDA declined by Rs 144 crore. The presentation’s separate financial-performance table reports FY2024 EBITDA of Rs 479 crore, compared with Rs 481 crore in the historic income statement, but both tables show a 25% margin; neither states an operational reason for the FY2026 decline.
What happened to Epigral’s revenue and gross margin?
Epigral’s FY2026 revenue was Rs 987 crore higher than in FY2022, but gross margin declined to 37% from 46%. Gross profit increased from Rs 716 crore in FY2022 to Rs 941 crore in FY2026, while the nine-percentage-point reduction in gross margin shows gross profit rose more slowly than sales over the period.
The annual record shows a recovery followed by a decline. Revenue fell to Rs 1,936 crore in FY2024 from Rs 2,196 crore in FY2023, then rose to Rs 2,565 crore in FY2025 before easing to Rs 2,542 crore in FY2026. Gross profit was Rs 1,067 crore in FY2025 and declined by Rs 126 crore to Rs 941 crore in FY2026, while gross margin moved from 42% to 37%.
Costs below EBITDA also increased over the five years. Depreciation rose from Rs 86 crore in FY2022 to Rs 168 crore in FY2026, while finance cost increased from Rs 44 crore to Rs 72 crore. Profit before tax, or PBT, was Rs 342 crore in FY2026, below Rs 383 crore in FY2022 and Rs 540 crore in FY2025 despite FY2026 revenue exceeding the FY2022 level.
How did Epigral’s net profit change in FY2026?
Epigral reported profit after tax, or PAT, of Rs 333 crore and a 13% PAT margin in FY2026, compared with Rs 357 crore and a 14% margin in FY2025. Reported FY2026 PAT was Rs 80 crore above the Rs 253 crore reported in FY2022, but its margin was three percentage points below FY2022’s 16%.
The presentation identifies a tax-related item in the FY2026 result. Epigral says its shift to a 25.17% tax rate reduced deferred tax liability by Rs 81 crore, and that PAT would have been Rs 252 crore excluding this reduction. That figure was Rs 105 crore below reported FY2025 PAT and Rs 81 crore below reported FY2026 PAT.
Earnings per share, or EPS, was Rs 77.1 in FY2026, down from Rs 84.4 in FY2025 and Rs 85.0 in FY2023, though above Rs 60.8 in FY2022. The FY2026 PBT of Rs 342 crore was Rs 198 crore lower than in FY2025, before the stated deferred-tax-liability reduction affected reported PAT.
Got a follow-up? Ask IRIS
What happened to Epigral’s returns on capital and equity?
Epigral’s return on capital employed, or ROCE, fell to 16% in FY2026 from 29% in FY2022 and a five-year high of 32% in FY2023. The presentation specifies that capital employed for the ROCE calculation includes capital work in progress, meaning projects not yet completed are included in the reported capital base.
Return on equity, or ROE, followed the same broad direction, declining to 16% in FY2026 from 36% in FY2022 and 39% in FY2023. Both measures were 17% in FY2024, recovered to 25% ROCE and 23% ROE in FY2025, and then declined again in FY2026, when each ratio was 16%.
The FY2026 return figures coincided with a larger fixed-asset base. Fixed assets increased to Rs 2,568 crore in FY2026 from Rs 2,302 crore in FY2025 and Rs 2,249 crore in FY2024. The source provides the ratio history and asset balances but does not state a causal link between the Rs 266 crore year-on-year increase in fixed assets and the nine-percentage-point decline in FY2026 ROCE.
How did Epigral’s balance sheet and leverage change?
Epigral’s net debt-to-EBITDA ratio was 0.9 times in FY2026, compared with 1.9 times in FY2022 and 2.0 times in FY2024. The ratio was 0.7 times in FY2025, so it increased by 0.2 times in FY2026 while remaining below the FY2022 to FY2024 readings shown in the presentation.
Long-term borrowings declined to Rs 334 crore in FY2026 from Rs 492 crore in FY2024 and Rs 449 crore in FY2025. Short-term borrowings, however, rose to Rs 229 crore in FY2026 from Rs 136 crore in FY2025, while trade payables increased to Rs 260 crore from Rs 186 crore during the same period.
Working-capital balances also changed in FY2026. Trade receivables increased by Rs 185 crore to Rs 417 crore, while inventories decreased by Rs 39 crore to Rs 349 crore. Total balance-sheet assets and liabilities were each Rs 3,505 crore in FY2026, up from Rs 3,151 crore in FY2025, and reserves and surplus increased to Rs 2,178 crore from Rs 1,860 crore.
Conclusion
Epigral’s five-year record shows revenue rising from Rs 1,555 crore in FY2022 to Rs 2,542 crore in FY2026, while gross margin, EBITDA margin, ROCE and ROE all ended below their FY2022 levels. The FY2026 EBITDA margin of 22% was the lowest in the displayed five-year series, and reported PAT of Rs 333 crore included the disclosed Rs 81 crore deferred-tax-liability reduction.
What to watch next is execution of Epigral’s stated plan to scale existing product capacities, add value-added products to existing value chains and enter new specialty-chemical value chains. The company also discloses a planned entry into epoxy resin and formulations and the setting up of MPP, alongside products including caustic soda, caustic potash, chloromethanes, hydrogen peroxide, CPVC, epichlorohydrin and the chlorotoluenes value chain.