










Fiem cash falls Rs 113.03 crore as spending exceeds inflow
Key highlights
- Fiem’s standalone cash and cash equivalents fell Rs 113.03 crore to Rs 163.42 crore in the six months ended September 30, 2026.
- Fiem generated Rs 95.25 crore of operating cash flow, compared with Rs 94.12 crore in the corresponding 2025 period.
- Fiem spent Rs 108.17 crore on asset purchases, compared with Rs 56.74 crore in the prior-year six-month period.
- Fiem paid Rs 105.28 crore of equity dividends, compared with Rs 78.96 crore a year earlier.
powered by IRIS
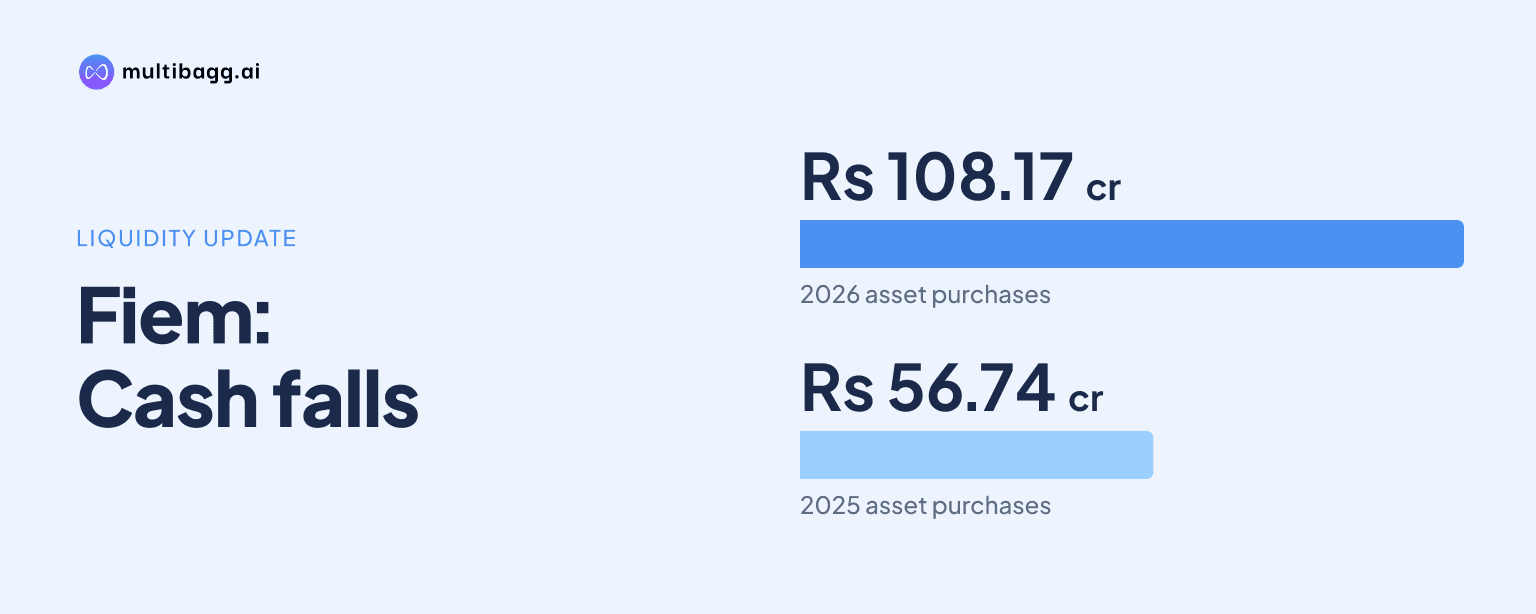
Fiem Industries Limited’s standalone cash and cash equivalents fell Rs 113.03 crore in the six months ended September 30, 2026, closing at Rs 163.42 crore, as Rs 98.60 crore of investing outflow and Rs 109.68 crore of financing outflow exceeded Rs 95.25 crore generated from operations. The net decline was Rs 27.83 crore in the comparable 2025 period.
Know Fiem Industries inside out
Results, valuation, peers and who's buying, in one view.
Why did Fiem’s cash balance fall in the six months to September 2026?
Fiem’s cash balance fell because capital expenditure, dividends and lease payments together exceeded cash generated by operations in the six months ended September 30, 2026. Cash and cash equivalents decreased from Rs 276.45 crore at March 31, 2026 to Rs 163.42 crore, a net reduction of Rs 113.03 crore.
The cash reduction widened from Rs 27.83 crore in the six months ended September 30, 2025. Net cash from operating activities increased by Rs 1.13 crore year on year, but investing outflow increased by Rs 56.91 crore and financing outflow rose by Rs 29.41 crore, resulting in a larger overall decrease.
Fiem prepared the standalone cash-flow statement under the indirect method prescribed by Indian Accounting Standard 7, or Ind AS 7. It began with profit before tax of Rs 202.59 crore, then adjusted for items including depreciation and amortisation of Rs 38.30 crore and changes in working capital before arriving at cash flows.
How much operating cash did Fiem generate?
Fiem generated net operating cash flow of Rs 95.25 crore in the six months ended September 30, 2026, compared with Rs 94.12 crore in the corresponding 2025 period. Cash generated from operating activities was Rs 139.70 crore before income-tax payments of Rs 44.44 crore, compared with tax payments of Rs 36.14 crore a year earlier.
Operating profit before working-capital changes rose to Rs 231.67 crore from Rs 199.26 crore. The reported increase reflected profit before tax of Rs 202.59 crore and depreciation and amortisation of Rs 38.30 crore, partly offset by income on fixed deposits and other deposits of Rs 7.56 crore.
Working-capital movements absorbed cash through a Rs 142.84 crore increase in trade receivables and a Rs 75.85 crore increase in inventories. These uses were partly offset by a Rs 100.91 crore increase in trade payables and a Rs 19.79 crore increase in other current liabilities.
The receivables cash outflow was Rs 92.99 crore in the six months ended September 30, 2025, while the inventory outflow was Rs 14.99 crore. Trade payables supplied Rs 100.91 crore of cash in the latest period, compared with Rs 55.49 crore a year earlier, partly financing the higher investment in receivables and stock.
How much did Fiem spend on capital expenditure?
Fiem spent Rs 108.17 crore on purchases of property, plant and equipment, intangible assets, capital work-in-progress and capital advances, net of sales, in the six months ended September 30, 2026. The expenditure was Rs 56.74 crore in the comparable 2025 period, making the latest investment spend Rs 51.43 crore higher.
Net cash used in investing activities was Rs 98.60 crore after Fiem received Rs 2.05 crore of capital subsidy and Rs 7.56 crore of income on fixed deposits and other deposits. In the comparable 2025 period, investing outflow was Rs 41.68 crore, with Rs 3.66 crore of subsidy and Rs 11.39 crore of deposit income recorded.
The September 2026 balance sheet showed property, plant and equipment of Rs 554.23 crore, up from Rs 530.63 crore at March 31, 2026. Capital work-in-progress increased more sharply to Rs 44.15 crore from Rs 14.87 crore, consistent with investment in assets not yet commissioned or completed.
Fiem’s standalone Automotive Segment generated revenue of Rs 1,709.30 crore in the six months ended September 30, 2026, compared with Rs 2.96 crore from the Others Segment. The Automotive Segment includes automotive lighting and signalling equipment, rear-view mirrors, plastic-moulded parts and other automotive components, while Others includes LED luminaries, display panels and integrated passenger information systems.
Got a follow-up? Ask IRIS
How did dividends and leases affect Fiem’s cash flow?
Fiem used Rs 109.68 crore in financing activities during the six months ended September 30, 2026, led by a Rs 105.28 crore payment of dividends on equity shares. Dividend payments were Rs 78.96 crore in the prior-year six-month period, so the latest payment was Rs 26.32 crore higher.
Payments of finance leases rose to Rs 4.32 crore from Rs 1.23 crore a year earlier, while finance costs paid other than finance leases were Rs 0.08 crore. Together, those payments took financing outflow to Rs 109.68 crore, compared with Rs 80.27 crore in the six months ended September 30, 2025.
The standalone balance sheet reported no borrowings at either September 30, 2026 or March 31, 2026. It reported lease liabilities of Rs 63.35 crore at September 30, including Rs 57.16 crore of non-current lease liabilities and Rs 6.19 crore of current lease liabilities.
Standalone equity increased to Rs 1,252.69 crore at September 30, 2026 from Rs 1,209.49 crore at March 31, 2026. Other equity rose to Rs 1,226.37 crore from Rs 1,183.17 crore, while equity share capital remained Rs 26.32 crore.
What does Fiem’s September 2026 balance sheet show?
Fiem’s standalone total assets increased to Rs 1,874.15 crore at September 30, 2026 from Rs 1,694.52 crore at March 31, 2026. Non-current assets rose to Rs 728.66 crore from Rs 658.27 crore, while current assets increased to Rs 1,145.50 crore from Rs 1,036.25 crore.
Inventories reached Rs 342.62 crore at September 30 from Rs 266.77 crore at March 31, matching the Rs 75.85 crore cash-flow absorption recorded in the statement. Trade receivables rose to Rs 532.50 crore from Rs 388.16 crore over the same dates, broadly corresponding to the Rs 142.84 crore working-capital outflow.
Current liabilities increased to Rs 532.51 crore from Rs 398.87 crore at March 31, 2026. Trade payables to creditors other than micro and small enterprises rose to Rs 341.02 crore from Rs 254.42 crore, which aligns with the Rs 100.91 crore cash inflow from higher trade payables in the cash-flow statement.
Fiem reported standalone net profit of Rs 149.36 crore for the six months ended September 30, 2026, up from Rs 119.84 crore a year earlier. Profit growth was therefore accompanied by a modest rise in operating cash generation, but this was insufficient to fund the Rs 108.17 crore of asset purchases and Rs 105.28 crore of dividend payments.
Conclusion
Fiem’s cash movement in the six months ended September 30, 2026 reflects a period in which Rs 95.25 crore of operating cash inflow was directed alongside the opening cash balance towards Rs 108.17 crore of capital expenditure, Rs 105.28 crore of dividends and higher working-capital requirements. The result was a Rs 113.03 crore reduction in standalone cash and cash equivalents.
The next results will show whether receivables of Rs 532.50 crore and inventories of Rs 342.62 crore convert into cash, and how capital work-in-progress of Rs 44.15 crore develops. Fiem also said final settlement of its estimated Rs 82.30 crore Tapukara insurance claim remains subject to the insurer’s assessment, with any additional accounting impact to be recorded on finalisation.