










Finolex Cables H1 revenue rises 55% as margin reaches 13%
Key highlights
- Finolex Cables reported H1 FY27 standalone revenue of Rs 4,282 crore, up 54.5% year on year.
- Standalone EBITDA rose 103.3% to Rs 557 crore, and EBITDA margin increased 312 bps to 13.0%.
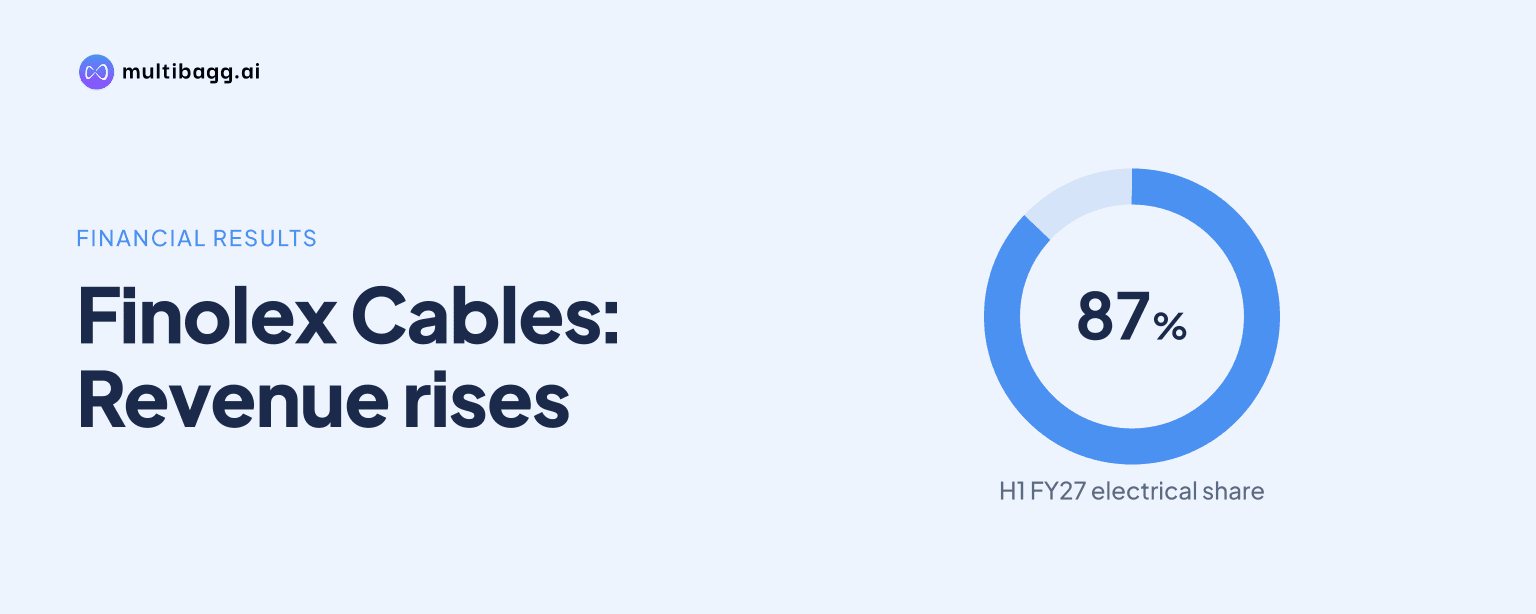
- Electrical Cables generated Rs 3,728 crore of H1 FY27 revenue, or 87% of the revenue mix.
- Communication Cables H1 FY27 EBIT rose to Rs 121.39 crore from Rs 2.51 crore a year earlier.
powered by IRIS
In H1 FY27, Finolex Cables Limited increased standalone revenue by 54.5% year on year to Rs 4,282 crore and more than doubled EBITDA to Rs 557 crore, lifting its EBITDA margin to 13.0% from 9.9%. The 312-basis-point expansion followed 57.0% gross-profit growth while total operating expenses increased 8.7%.
Know Finolex Cables inside out
Results, valuation, peers and who's buying, in one view.
How did Finolex Cables perform in H1 FY27?
Finolex Cables reported standalone revenue of Rs 4,282 crore for H1 FY27, compared with Rs 2,771 crore in H1 FY26, a 54.5% increase. Earnings before interest, tax, depreciation and amortisation, or EBITDA, rose 103.3% to Rs 557 crore from Rs 274 crore, while profit after tax, or PAT, increased 55.9% to Rs 508 crore from Rs 326 crore.
The improvement was also visible in the second quarter. Revenue reached Rs 2,269 crore in Q2 FY27, up 64.9% from Rs 1,376 crore in Q2 FY26 and 12.7% from Rs 2,011 crore in Q1 FY27. Q2 FY27 EBITDA was Rs 309 crore, compared with Rs 143 crore a year earlier and Rs 248 crore in the preceding quarter; PAT was Rs 286 crore, versus Rs 187 crore and Rs 221 crore, respectively.
Earnings before interest and tax, or EBIT, rose 59.2% to Rs 653 crore in H1 FY27 from Rs 410 crore in H1 FY26. Earnings per share increased to Rs 33.19 from Rs 21.30. These figures are from the standalone statement, where Finolex Cables calculates EBITDA excluding other income.
Why did Finolex Cables' EBITDA margin expand in H1 FY27?
Finolex Cables' standalone EBITDA margin expanded because revenue and gross profit grew faster than operating costs in H1 FY27. Gross profit rose 57.0% to Rs 842 crore while revenue rose 54.5% to Rs 4,282 crore, taking gross margin up 31 basis points, or bps, to 19.7% from 19.4%.
The larger margin movement occurred below gross profit. Employee cost increased 13.9% to Rs 112 crore and other operating expenses increased 5.6% to Rs 173 crore, resulting in total operating-expense growth of 8.7% to Rs 285 crore. That was below the 54.5% revenue increase, and EBITDA margin consequently rose to 13.0% from 9.9%.
The same pattern was evident quarter on quarter. Q2 FY27 gross margin was 19.9%, compared with 19.4% in Q1 FY27, while EBITDA margin increased 131 bps to 13.6% from 12.3%. Finolex Cables said the pricing environment was favourable and that effective pass-through of raw-material price increases reflected its pricing and credit discipline.
Other income did not drive the stated EBITDA result because Finolex Cables calculates EBITDA before other income. In H1 FY27, other income declined 14.5% to Rs 140 crore, while depreciation increased 59.2% to Rs 44 crore; nevertheless, standalone PAT margin edged up 10 bps to 11.9% from 11.8%.
Got a follow-up? Ask IRIS
Which Finolex Cables segments drove H1 FY27 growth?
Electrical Cables was the largest reported segment in H1 FY27, with revenue rising 56% to Rs 3,728 crore from Rs 2,393 crore and EBIT increasing 62% to Rs 399 crore from Rs 247 crore. The segment represented 87% of H1 FY27 revenue mix, up from 86% in H1 FY26.
Within Electrical Cables, Finolex Cables cited growth in automobile, agriculture, industrial and solar applications. Q2 FY27 revenue was Rs 1,960 crore, 65% above Rs 1,188 crore in Q2 FY26 and 11% above Rs 1,767 crore in Q1 FY27. Segment EBIT reached Rs 217 crore in the quarter, compared with Rs 129 crore a year earlier.
Communication Cables produced the faster percentage growth from a smaller base. H1 FY27 revenue increased 89% to Rs 406 crore from Rs 215 crore, and EBIT rose to Rs 121.39 crore from Rs 2.51 crore. Finolex Cables attributed the profitability change to demand for optical-fibre cables and better margins, while noting continuing export demand alongside global supply-chain challenges.
The Others segment, mainly trading of electrical and other goods, expanded less rapidly. Its H1 FY27 revenue was Rs 135 crore, up 5% from Rs 128 crore, and EBIT was Rs 2.76 crore, up 27% from Rs 2.17 crore. Its revenue mix was 3%, lower than 5% in H1 FY26, while Communication Cables increased its mix to 9% from 8%.
What changed in Finolex Cables' working capital in H1 FY27?
Finolex Cables' working-capital days increased in H1 FY27, led by inventory. Inventory days were 77 at the end of H1 FY27 versus 64 in H1 FY26, while receivable days rose to 19 from 15 and payable days declined to 14 from 22.
The presentation's Q2 comparison also shows higher inventory, receivables and lower payables than a year earlier. Inventory days were 73 in Q2 FY27 versus 65 in Q2 FY26, receivable days were 18 versus 15, and payable days were 14 versus 22. The table lists Q1 FY26, rather than Q1 FY27, at 73 inventory days, so it does not provide a Q1 FY27 sequential comparator.
Profit before tax, or PBT, increased to Rs 652 crore in H1 FY27 from Rs 409 crore in H1 FY26. The presentation's September 2025-to-September 2026 profit bridge shows a Rs 306 crore positive margin movement, partly offset by a Rs 23.77 crore decline in other income, Rs 16 crore of depreciation and Rs 13.69 crore of employee cost.
Conclusion
Finolex Cables converted H1 FY27 revenue growth of 54.5% into a 103.3% increase in standalone EBITDA, with margin rising 312 bps to 13.0%. Electrical Cables supplied Rs 3,728 crore of revenue and Communication Cables delivered Rs 121.39 crore of EBIT, while gross-margin improvement and slower operating-cost growth supported the wider EBITDA margin.
The next results will show whether Finolex Cables can sustain pricing pass-through and segment margins while inventory stands at 77 days and payables at 14 days. Management has disclosed ongoing capacity expansion across its five manufacturing facilities to meet rising demand and improve efficiency, but the presentation gives no capacity target or completion date to measure that plan against.