










Fredun Pharmaceuticals Limited cash flow trails half-year profit
Key highlights
- Fredun Pharmaceuticals generated Rs 19.25 crore of standalone operating cash flow in the half year ended 30 September 2026, versus Rs 14.03 crore a year earlier.
- Inventory increased by Rs 102.64 crore to Rs 372.45 crore on 30 September 2026.
- Fixed-asset purchases were Rs 38.37 crore, compared with Rs 20.39 crore in the prior-year half.
- Standalone net profit after tax was Rs 31.99 crore, while the cash flow statement reported a Rs 9.75 crore decrease in cash and bank balances.
powered by IRIS
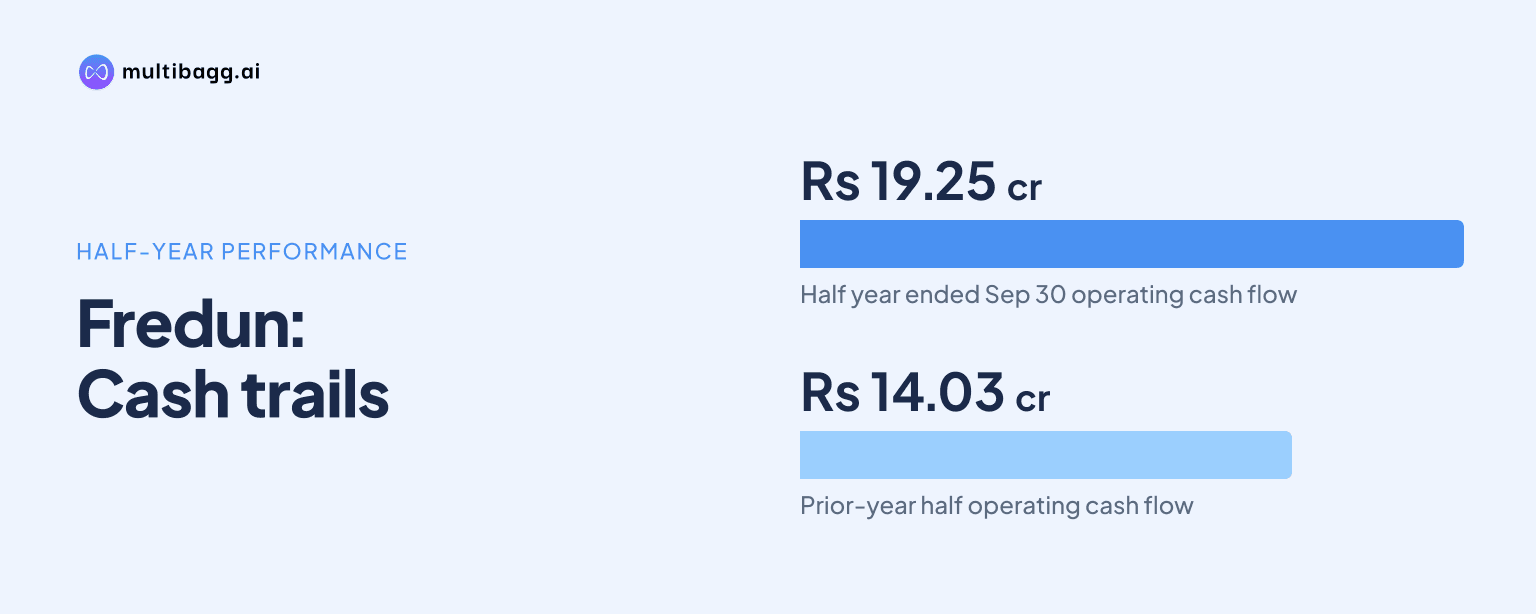
Fredun Pharmaceuticals reported standalone operating cash flow of Rs 19.25 crore for the half year ended 30 September 2026, below Rs 31.99 crore net profit, after inventory increased by Rs 102.64 crore and fixed-asset purchases totalled Rs 38.37 crore. The cash flow statement showed a Rs 9.75 crore decline in cash and bank balances.
Know Fredun Pharmaceuticals inside out
Results, valuation, peers and who's buying, in one view.
Why did Fredun Pharmaceuticals’ operating cash flow trail profit?
Fredun Pharmaceuticals’ operating cash flow trailed accounting profit because working-capital movements absorbed cash in the half year ended 30 September 2026. Net profit after tax was Rs 31.99 crore, while net cash flow from operating activities was Rs 19.25 crore, a difference of Rs 12.75 crore between the two reported measures.
The cash flow statement starts with Rs 31.99 crore of profit and adds back Rs 7.49 crore of depreciation. It also records Rs 17.39 crore of interest paid, a Rs 4.73 crore deferred-tax-liability adjustment and a Rs 13.77 crore tax-provision adjustment. These reported items took operating profit before working-capital changes to Rs 74.43 crore.
Working-capital changes reduced that pre-working-capital amount by Rs 55.11 crore. The largest individual cash outflow was the Rs 102.64 crore increase in inventory. Trade receivables rose by Rs 4.35 crore, loans and advances increased by Rs 0.24 crore, and other current assets rose by Rs 6.21 crore.
Other movements partly offset these outflows. Other financial assets generated a Rs 40.09 crore inflow, trade payables rose by Rs 34.85 crore, and other current liabilities increased by Rs 6.42 crore. Short-term provisions used Rs 9.54 crore and long-term provisions fell by Rs 0.07 crore, resulting in the reported Rs 19.25 crore operating cash flow.
How much did Fredun Pharmaceuticals’ inventory increase?
Fredun Pharmaceuticals’ inventory increased by Rs 102.64 crore during the half year ended 30 September 2026, reaching Rs 372.45 crore on 30 September from Rs 269.80 crore on 31 March 2026. The increase was more than twice the Rs 49.45 crore inventory-related cash outflow reported for the half year ended 30 September 2025.
The balance sheet places the Rs 372.45 crore inventory balance within current assets, which totalled Rs 560.56 crore on 30 September 2026, compared with Rs 496.95 crore on 31 March 2026. Inventory was the largest reported current-asset balance, ahead of trade and other receivables of Rs 97.03 crore.
The income statement recorded a negative Rs 54.09 crore under changes in inventories of finished goods, work in progress and stock in trade for the 2026 half year. That expense-line presentation differs from the Rs 102.64 crore increase in the balance-sheet inventory category, and the filing gives no product-level explanation reconciling the two measures.
Revenue rose alongside the inventory build. Net sales and income from operations were Rs 493.61 crore for the half year ended 30 September 2026, compared with Rs 262.99 crore a year earlier. Total income from operations rose to Rs 495.88 crore from Rs 265.15 crore, while cost of material consumed increased to Rs 418.28 crore from Rs 189.58 crore.
Got a follow-up? Ask IRIS
What did Fredun Pharmaceuticals spend on fixed assets?
Fredun Pharmaceuticals spent Rs 38.37 crore on purchases of fixed assets in the half year ended 30 September 2026, compared with Rs 20.39 crore in the corresponding 2025 half year. Fixed-asset sales generated Rs 0.16 crore, leaving Rs 38.21 crore of net cash used in investing activities.
Property, plant and equipment stood at Rs 148.26 crore on 30 September 2026, up from Rs 117.61 crore on 31 March 2026. The Rs 30.65 crore increase in the carrying amount was recorded after a Rs 7.49 crore depreciation charge, while the cash flow statement separately reports the Rs 38.37 crore purchase outlay.
Other non-current assets increased to Rs 26.49 crore from Rs 8.05 crore over the six-month period. The cash flow statement includes a Rs 18.39 crore outflow under other non-current assets in its financing section, but it does not identify the asset types involved or state whether that amount relates to fixed-asset purchases.
Total non-current assets rose to Rs 207.44 crore on 30 September 2026 from Rs 144.26 crore on 31 March 2026. Along with property, plant and equipment, other financial assets increased to Rs 29.46 crore from Rs 15.96 crore, investments rose to Rs 2.54 crore from Rs 2.02 crore, and intangible assets increased to Rs 0.69 crore from Rs 0.63 crore.
How did Fredun Pharmaceuticals fund its cash outflows?
Fredun Pharmaceuticals reported Rs 9.22 crore of net cash from financing activities for the half year ended 30 September 2026, alongside Rs 19.25 crore of operating inflow and Rs 38.21 crore of investing outflow. The cash flow statement consequently reports a Rs 9.75 crore net decrease in cash and bank balances, from Rs 64.95 crore to Rs 55.21 crore.
Long-term borrowings increased by Rs 30.62 crore in financing cash flow, while short-term borrowings decreased by Rs 6.01 crore. The balance sheet shows non-current borrowings at Rs 86.93 crore on 30 September 2026, up from Rs 56.31 crore on 31 March, while current borrowings were Rs 159.71 crore, down from Rs 165.72 crore.
Equity-related financing included Rs 19.91 crore from share premium, Rs 0.16 crore from share capital and Rs 0.93 crore from share warrants. Fredun Pharmaceuticals said it allotted 160,533 equity shares through conversion of 160,533 warrants during the half year and separately allotted 11,025,380 fully paid bonus shares on 16 July 2026 in a two-for-one ratio.
Interest payments were Rs 17.39 crore in the half year ended 30 September 2026, compared with Rs 14.26 crore in the prior-year half. Finance costs in the standalone income statement also increased to Rs 17.39 crore from Rs 14.26 crore, while dividend payout was reported at Rs 0.35 crore.
Conclusion
Fredun Pharmaceuticals reported higher revenue, profit and operating cash flow in the half year ended 30 September 2026, but the Rs 102.64 crore inventory build and Rs 38.37 crore fixed-asset purchases absorbed cash. Operating cash flow increased to Rs 19.25 crore from Rs 14.03 crore a year earlier, while remaining below the Rs 31.99 crore net profit for the period.
The next disclosures can show whether inventory, at Rs 372.45 crore on 30 September 2026, stabilises or rises further and how the fixed-asset spending affects the asset base. Fredun Pharmaceuticals has also disclosed a board-approved proposal to apply to the National Stock Exchange of India Limited for listing and trading of its equity shares, subject to applicable laws, regulations and necessary approvals.