










Gennex revenue rose 13.5% as quarterly profit fell 11.7%
Key highlights
- Gennex’s Q2 FY27 revenue from operations rose 13.5% to Rs 42.2647 crore.
- Gennex’s Q2 FY27 net profit declined 11.7% to Rs 4.8693 crore.
- Gennex’s Q2 FY27 finance cost increased 35.6% to Rs 1.3953 crore.
- Gennex used Rs 36.0084 crore of operating cash in the first half of FY27.
powered by IRIS
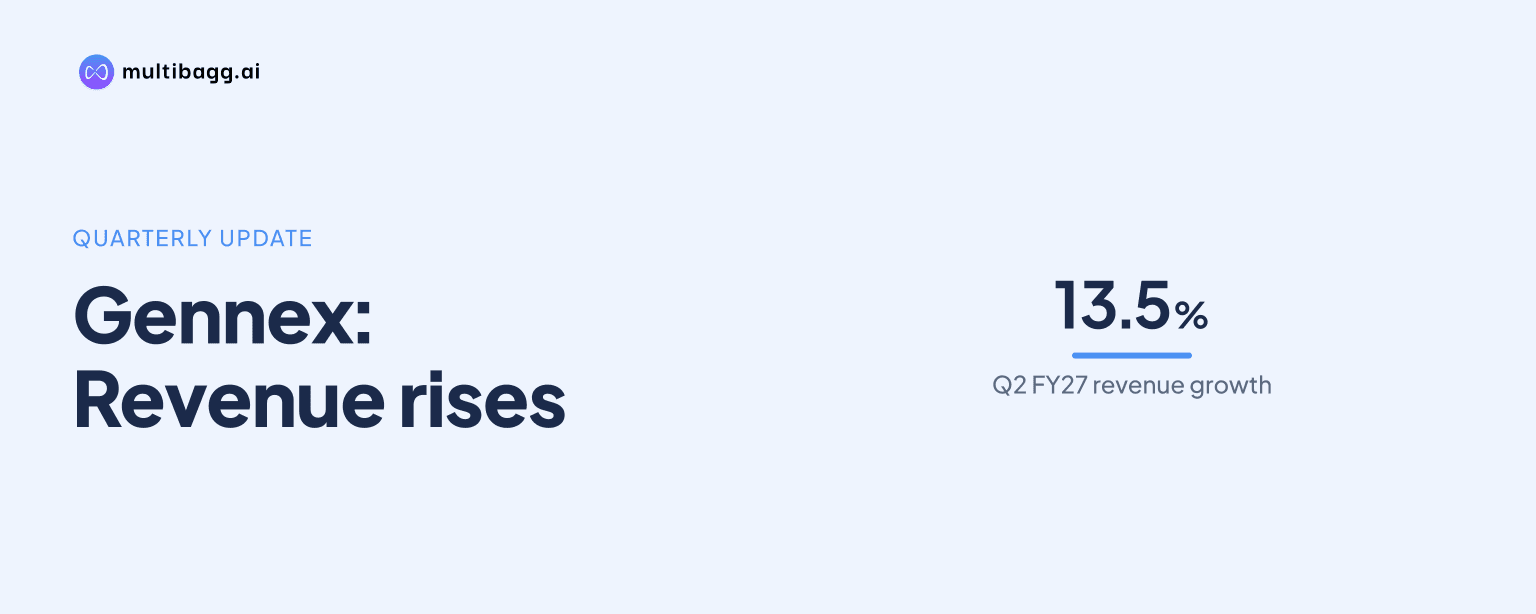
Gennex Laboratories Limited reported consolidated revenue from operations of Rs 42.2647 crore for the quarter ended September 30, 2026, up 13.5% from Rs 37.2421 crore a year earlier, but net profit fell 11.7% to Rs 4.8693 crore as material, employee and finance costs increased. Gennex’s profit before tax margin narrowed to about 11.6% from about 15.4%.
Know Gennex Laboratories inside out
Results, valuation, peers and who's buying, in one view.
Why did Gennex’s Q2 profit fall despite higher revenue?
Gennex’s quarterly net profit fell because the rise in key operating costs exceeded the gain in revenue. Revenue from operations increased by Rs 5.0226 crore year on year, while cost of material consumed rose by Rs 4.3955 crore to Rs 34.9523 crore. Employee benefit expense increased 33.3% to Rs 2.45 crore, and finance cost rose 35.6% to Rs 1.3953 crore.
The result was a decline in profit before tax to Rs 5.1282 crore in the September 2026 quarter from Rs 6.0615 crore in the September 2025 quarter. Net profit declined to Rs 4.8693 crore from Rs 5.5115 crore, even as other expenses fell to Rs 3.8965 crore from Rs 4.4978 crore. Other operating income also reduced to Rs 1.7779 crore from Rs 2.0599 crore.
How did Gennex’s margins and earnings per share change?
Gennex’s profit before tax margin declined by about 3.8 percentage points to 11.6% in the September 2026 quarter, calculated against total income from operations of Rs 44.0426 crore. In the corresponding prior-year quarter, profit before tax of Rs 6.0615 crore represented about 15.4% of total income of Rs 39.302 crore. Net profit margin similarly moved to about 11.1% from about 14.0%.
Basic earnings per equity share, or EPS, were Rs 0.17 in Q2 FY27, compared with Rs 0.207 in Q2 FY26 and Rs 0.192 in the immediately preceding June 2026 quarter. Diluted EPS was also Rs 0.17, versus Rs 0.207 a year earlier. The paid-up equity share capital remained Rs 24.2948 crore, with a face value of Rs 1 per equity share.
The sequential comparison shows a different revenue and profit pattern. Revenue from operations grew 6.1% from Rs 39.8417 crore in the June 2026 quarter to Rs 42.2647 crore in Q2, while net profit increased 4.3% from Rs 4.6664 crore. However, finance cost increased from Rs 0.8997 crore in Q1 to Rs 1.3953 crore in Q2, and employee expense rose from Rs 1.9757 crore to Rs 2.45 crore.
Got a follow-up? Ask IRIS
What were Gennex’s half-year results for FY27?
Gennex reported revenue from operations of Rs 82.1064 crore for the six months ended September 30, 2026, a 15.0% increase from Rs 71.4196 crore in the comparable FY26 half year. Total income from operations rose to Rs 85.8925 crore from Rs 75.7869 crore, while profit before tax decreased to Rs 10.0446 crore from Rs 11.928 crore.
Net profit for the first half of FY27 was Rs 9.5357 crore, compared with Rs 10.528 crore in the first half of FY26, a decline of 9.4%. The half-year tax expense was Rs 0.5089 crore, versus Rs 1.4 crore a year earlier. Material consumption rose to Rs 64.6248 crore from Rs 54.3764 crore, while finance cost increased to Rs 2.295 crore from Rs 2.0081 crore.
Gennex operates in a single Bulk Drugs manufacturing segment, according to the filing. The company said it mainly deals in Guaifenesin and Methocarbamol and also conducts business outside India. Since it reports one operating segment, the filing says segment reporting under Accounting Standard 17 is not applicable.
What changed in Gennex’s balance sheet and cash flow?
Gennex’s consolidated total assets stood at Rs 380.9408 crore on September 30, 2026, compared with Rs 348.6752 crore at March 31, 2026. Current assets increased to Rs 293.5443 crore from Rs 264.6559 crore, led by trade receivables of Rs 71.7909 crore, up from Rs 43.5566 crore, and inventories of Rs 60.6511 crore, up from Rs 53.8875 crore.
The funding mix also changed over the six months. Long-term borrowings fell to Rs 17.2263 crore from Rs 43.4073 crore, while short-term borrowings increased to Rs 71.5486 crore from Rs 35.9536 crore. Trade payables rose to Rs 30.0591 crore from Rs 20.2988 crore, and other current liabilities increased to Rs 11.9386 crore from Rs 6.4473 crore.
Consolidated net cash used in operating activities was Rs 36.0084 crore for the period ended September 30, 2026. Receivables absorbed Rs 28.2345 crore of cash and inventories absorbed Rs 6.7636 crore, while cash generated from operations before tax was an outflow of Rs 35.4995 crore. Financing activities supplied Rs 31.3642 crore, including Rs 35.595 crore of changes in long-term borrowings.
Cash and cash equivalents ended the period at Rs 48.1281 crore, down from Rs 52.4179 crore at the beginning of the year. Gennex recorded Rs 0.3544 crore of net cash from investing activities, reflecting Rs 3.1124 crore of interest income against Rs 2.758 crore spent on property, plant and equipment.
Conclusion
Gennex delivered higher Q2 and first-half revenue in FY27, but the increase did not produce higher profits. In Q2, revenue from operations rose 13.5% to Rs 42.2647 crore while net profit declined 11.7% to Rs 4.8693 crore, as higher material, employee and finance costs coincided with a lower profit before tax margin.
The next disclosures should show whether the September 30, 2026 increase in trade receivables to Rs 71.7909 crore and inventories to Rs 60.6511 crore is converted into operating cash. They should also indicate whether the shift from Rs 43.4073 crore of long-term borrowings at March 31, 2026 to Rs 71.5486 crore of short-term borrowings at September 30 affects finance costs further.