










Hariom revenue nearly quadrupled; net debt/EBITDA reached 1.7 times
Key highlights
- Hariom revenue increased from Rs 431 crore in FY22 to Rs 1,667 crore in FY26.
- Hariom sales volume rose from 65,845 metric tonnes in FY22 to 288,517 metric tonnes in FY26.
- Hariom net debt-to-EBITDA declined from 2.4 times in FY24 to 1.7 times in FY26.
- Hariom gross block expanded from Rs 97 crore in FY22 to Rs 631 crore in FY26.
powered by IRIS
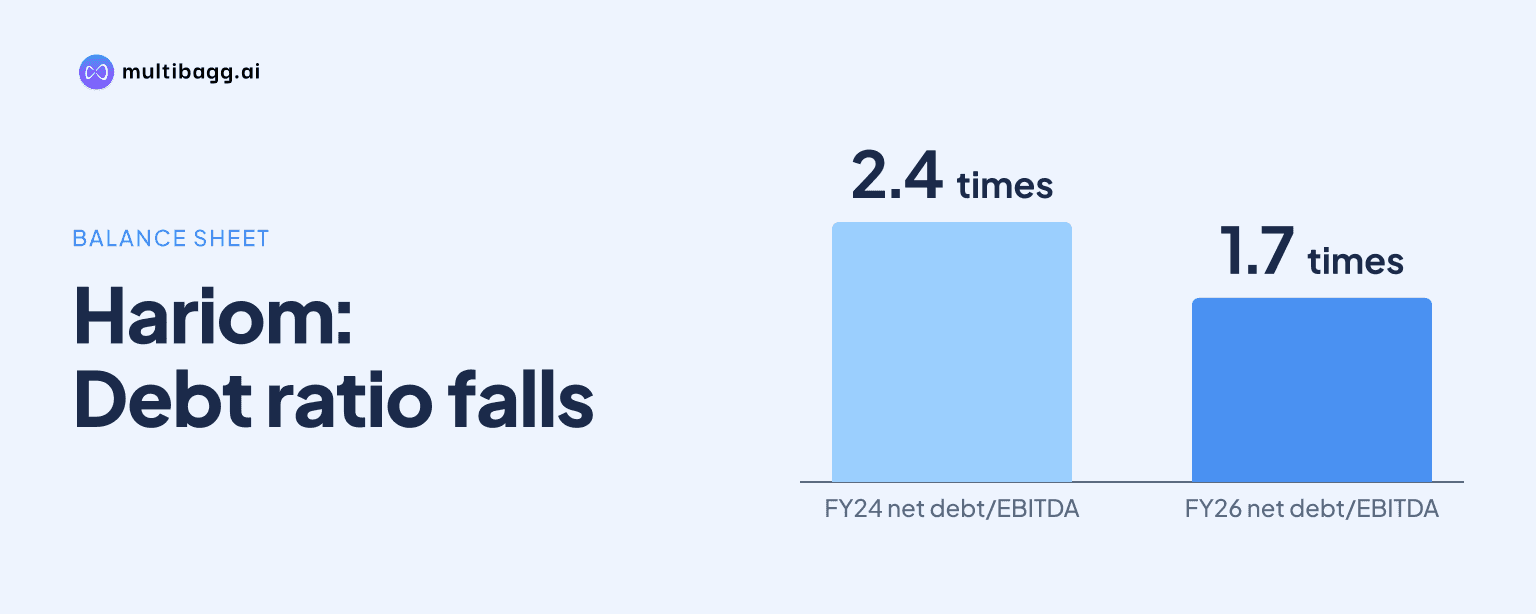
Hariom Pipe Industries Limited reported financial year (FY) 2026 revenue of Rs 1,667 crore, nearly four times the Rs 431 crore recorded in FY22, while net debt-to-earnings before interest, tax, depreciation and amortisation (EBITDA) was 1.7 times, down from 2.4 times in FY24. FY26 sales volume reached 288,517 metric tonnes.
Know Hariom Pipe Industries inside out
Results, valuation, peers and who's buying, in one view.
How fast did Hariom’s revenue and EBITDA grow?
Hariom’s revenue increased to Rs 1,667 crore in FY26 from Rs 431 crore in FY22, and the presentation reports a 40% compound annual growth rate (CAGR) for FY22-FY26. Revenue rose each year, reaching Rs 644 crore in FY23, Rs 1,153 crore in FY24 and Rs 1,357 crore in FY25. The largest annual increase was Rs 509 crore between FY23 and FY24, compared with Rs 310 crore in FY26.
EBITDA excluding other income rose to Rs 209 crore in FY26 from Rs 56 crore in FY22, a stated 39% CAGR. EBITDA margin moved within a 12.0% to 13.0% range across the five years, ending at 12.6% in FY26 versus 13.0% in FY22. The standalone income statement reports slightly more precise EBITDA figures of Rs 209.4 crore in FY26 and Rs 56.1 crore in FY22.
Did Hariom’s net profit keep pace with revenue?
Hariom’s profit after tax (PAT) rose to Rs 75.8 crore in FY26 from Rs 32.0 crore in FY22, but its stated 24% CAGR was below the 40% revenue CAGR and 39% EBITDA CAGR. PAT increased in every reported year, from Rs 46.2 crore in FY23 to Rs 56.8 crore in FY24 and Rs 61.7 crore in FY25, while profit before tax reached Rs 103.9 crore in FY26.
The presentation shows depreciation rising from Rs 8.1 crore in FY22 to Rs 65.2 crore in FY26 and interest expense increasing from Rs 8.2 crore to Rs 53.5 crore. PAT margin declined from 7.38% in FY22 to 4.51% in FY26, after falling to 4.90% in FY24. Basic earnings per share increased to Rs 24.49 in FY26 from Rs 18.83 in FY22.
What drove Hariom’s sales expansion?
Hariom’s sales volume increased to 288,517 metric tonnes in FY26 from 65,845 metric tonnes in FY22, representing a stated 45% CAGR. Volumes reached 109,085 metric tonnes in FY23, 199,015 metric tonnes in FY24 and 245,467 metric tonnes in FY25. The increase of 222,672 metric tonnes over the period accompanied a Rs 1,236 crore increase in revenue.
High-value product sales rose faster than total volume, at a stated 59% CAGR, from 43,310 metric tonnes in FY22 to 278,207 metric tonnes in FY26. Hariom identifies thin-gauge and value-added pipes and coils as its focus, including the 0.3 to 2.5 millimetre steel segment. The company estimates that segment accounted for about 15% of India’s steel consumption in FY25 and estimates its own market share at 13%.
Got a follow-up? Ask IRIS
How did Hariom’s leverage and working capital change?
Hariom’s net debt-to-EBITDA declined to 1.7 times in FY26 from 2.0 times in FY25 and 2.4 times in FY24, although it remained above the 1.4 times reported in FY22. Net debt-to-equity was 0.5 times in FY26, compared with 0.6 times in FY25 and 0.8 times in FY22. The presentation also reports an FY26 debt-equity ratio of 0.54 times.
Working-capital movements were mixed in FY26. Inventory days fell to 99 from 128 in FY25, while receivable days declined to 41 from 54 but remained above FY22’s 23 days. Payable days were 28 in FY26, down from 56 in FY25 and above 10 days in FY22. The company calculates receivable days using revenue, and inventory and creditor days using cost of goods sold.
How much did Hariom’s asset base expand?
Hariom’s gross block increased to Rs 631 crore in FY26 from Rs 97 crore in FY22, an expansion of Rs 534 crore. The sharpest annual increase occurred between FY23 and FY24, when gross block rose from Rs 185 crore to Rs 451 crore. Over that same year, sales volume increased from 109,085 metric tonnes to 199,015 metric tonnes.
The standalone balance sheet reports total assets of Rs 1,182.42 crore at FY26, compared with Rs 1,196.97 crore at FY25, before rising to Rs 1,376.56 crore at H1FY27. Non-current assets increased to Rs 624.97 crore at H1FY27 from Rs 540.05 crore at FY26, including work-in-progress of Rs 42.24 crore versus Rs 14.88 crore. Total equity increased to Rs 705.41 crore from Rs 646.64 crore.
What does Hariom’s H1FY27 balance sheet show?
Hariom reported total borrowings of Rs 438.44 crore at H1FY27, comprising Rs 143.00 crore of non-current borrowings and Rs 295.44 crore of current borrowings. That compares with Rs 346.71 crore at FY26, made up of Rs 114.76 crore in non-current borrowings and Rs 231.95 crore in current borrowings.
Current assets were Rs 751.59 crore at H1FY27, compared with Rs 642.37 crore at FY26, while inventories increased to Rs 473.41 crore from Rs 404.58 crore. Trade receivables rose to Rs 213.14 crore from Rs 189.07 crore. The presentation does not provide an H1FY27 net debt-to-EBITDA measure, so the FY26 ratio cannot be directly compared with the half-year balance sheet.
Conclusion
Hariom’s FY22-FY26 record combines revenue rising from Rs 431 crore to Rs 1,667 crore, EBITDA excluding other income increasing from Rs 56 crore to Rs 209 crore, and sales volume growing from 65,845 metric tonnes to 288,517 metric tonnes. EBITDA margin remained between 12.0% and 13.0%, while net debt-to-EBITDA declined from its FY24 peak of 2.4 times to 1.7 times in FY26.
The next disclosed marker is management’s FY27 volume-growth target, which it links to higher capacity utilisation, a greater contribution from value-added products and wider distribution. The Rs 42.24 crore of work-in-progress at H1FY27, up from Rs 14.88 crore at FY26, and the H1FY27 borrowing total of Rs 438.44 crore are balance-sheet measures to watch against that plan.