










Honda India Power Products reports ₹4.1 crore Q2 FY27 loss
Key highlights
- Honda India Power Products reported a net loss of ₹4.1 crore in Q2 FY27.
- Honda India Power Products earned a net profit of ₹11.10 crore on ₹189.25 crore of revenue in Q1 FY27.
- Q1 FY27 operating margin was 7.62%, down 367 basis points quarter on quarter.
- Honda India Power Products reported FY26 revenue of ₹903 crore and net profit of ₹64 crore in the supplied financial summary.
powered by IRIS
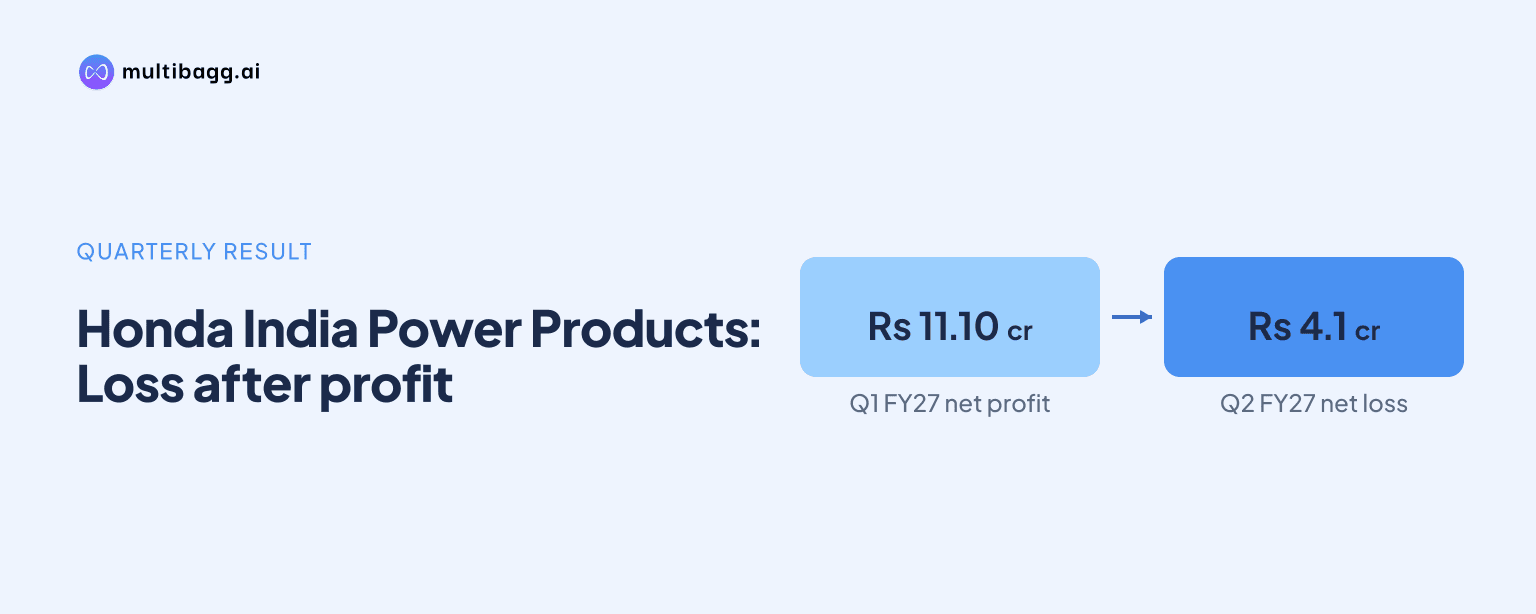
Honda India Power Products Ltd reported a net loss of ₹4.1 crore for Q2 FY27, with the company attributing the quarterly loss to an exceptional charge related to its voluntary career retirement policy. The result follows a profitable Q1 FY27, when Honda India Power Products reported net profit of ₹11.10 crore on revenue of ₹189.25 crore.
Know Honda India Power Products inside out
Results, valuation, peers and who's buying, in one view.
Why did Honda India Power Products report a Q2 FY27 loss?
Honda India Power Products reported the Q2 FY27 loss because of an exceptional charge arising from its voluntary career retirement policy. The company disclosed its unaudited quarterly results on November 5, 2026. The reported net loss was ₹4.1 crore.
An exceptional charge is distinct from regular operating expenses because it relates to a specific event or programme rather than routine business activity. In this case, the disclosed cause was the voluntary career retirement policy. The available information does not provide the amount of that charge, Q2 revenue, operating profit, or segment-level performance.
The company had informed the exchange on October 26 that its board would meet on November 5 to consider and approve unaudited financial results for the second quarter and first half of FY27. It also said the trading window would remain closed until November 7. The Q2 result was released following that scheduled board meeting.
How did the previous quarter compare with the Q2 result?
The Q2 loss contrasts with Honda India Power Products' Q1 FY27 performance, when it reported net profit of ₹11.10 crore and revenue of ₹189.25 crore. The Q1 profit was 17.09% higher year on year, while revenue rose 22.17% from the corresponding quarter a year earlier.
However, Q1 FY27 was weaker sequentially. Net profit declined 58.76% quarter on quarter and revenue fell 28.46% quarter on quarter, according to the supplied results summary. Operating margin in Q1 stood at 7.62%, down 367 basis points from the preceding quarter.
The quarterly results data rounds June 2026 revenue to ₹189 crore, expenses to ₹175 crore and operating profit to ₹14 crore. This implies that the pressure on profitability had already emerged before the Q2 exceptional item. The source linked the Q1 sequential slowdown to the seasonal nature of the power products business, under which demand is typically weaker in the first quarter.
Got a follow-up? Ask IRIS
What do the company's recent financial trends show?
Honda India Power Products' annual financial data show revenue of ₹903 crore in FY26, compared with ₹837 crore in FY25. That represented revenue growth of 7.93% in FY26 after an 18.82% decline in FY25.
Net profit was ₹64 crore in FY26, down 19.64% from ₹80 crore in FY25. The combination of higher revenue and lower annual profit indicates that revenue growth did not fully translate into earnings growth during FY26. The supplied annual profit and loss data separately show FY26 revenue of ₹865 crore, while the financial summary states ₹903 crore. This difference is retained as reported across the supplied data sources and should be reconciled with the company’s annual filings.
Over a longer period, annual revenue had reached ₹1,246 crore in FY23 before falling to ₹989 crore in FY24 and ₹794 crore in FY25. FY26 marked a recovery in revenue from that lower base. The latest trailing-twelve-month revenue in the supplied table was ₹900 crore, with operating profit of ₹88 crore.
What does the Q2 result mean for investors and operations?
For investors, the Q2 loss introduces a one-quarter reversal after the company remained profitable in Q1 FY27. The stated reason is important because it identifies the loss as being affected by a specific exceptional charge, rather than attributing it solely to ordinary operating performance. But the provided disclosure does not quantify the charge, so its precise effect on reported profit cannot be calculated from the available information.
The prior quarter's figures also point to the relevance of operating costs and seasonal demand. In Q1 FY27, revenue was up year on year but operating margin declined sequentially to 7.62%. The source described cost efficiency as a challenge during that period. Together with the Q2 exceptional charge, this makes the distinction between underlying operating performance and one-off items relevant when assessing the results.
As of June 2026, the company had a market capitalisation of ₹2,079 crore. No share-price movement, valuation multiple, promoter holding, debt-to-equity ratio, or Q2 earnings-per-share figure was provided with the Q2 announcement. Therefore, the supplied information does not establish a direct market reaction to the result.
Honda India Power Products' annual reports, quarterly results, earnings-call transcripts and investor presentations are available through the Annual Reports and Financial Documents section in the Resources tab. Those documents are the relevant source for further detail on the retirement policy charge, the half-year performance, and any management commentary released with the Q2 filing.
Conclusion
Honda India Power Products moved from a ₹11.10 crore profit in Q1 FY27 to a ₹4.1 crore loss in Q2 FY27, with the company identifying an exceptional voluntary career retirement policy charge as the reason for the quarterly loss. The result comes after FY26 revenue recovered, while annual net profit declined, and after Q1 margins weakened sequentially.
The next point to watch is the detailed Q2 and half-year FY27 filing approved at the November 5 board meeting, particularly any disclosure of the exceptional charge amount, revenue, margins and earnings per share. Investors can also review the company’s financial documents and future quarterly disclosures for evidence on operating cost management and demand conditions.