










Market capitalisation sorts Indian stocks by size, not price
Key highlights
- Nifty 50 has used free-float market capitalisation since 26 June 2009.
- Nifty 50 covered 53.73% of NSE free-float market capitalisation as on 30 March 2026.
- Nifty Next 50 closed at 72,575.75 on 7 September 2026.
- AMFI classifies the top 100 companies by average full market cap as large cap.
powered by IRIS
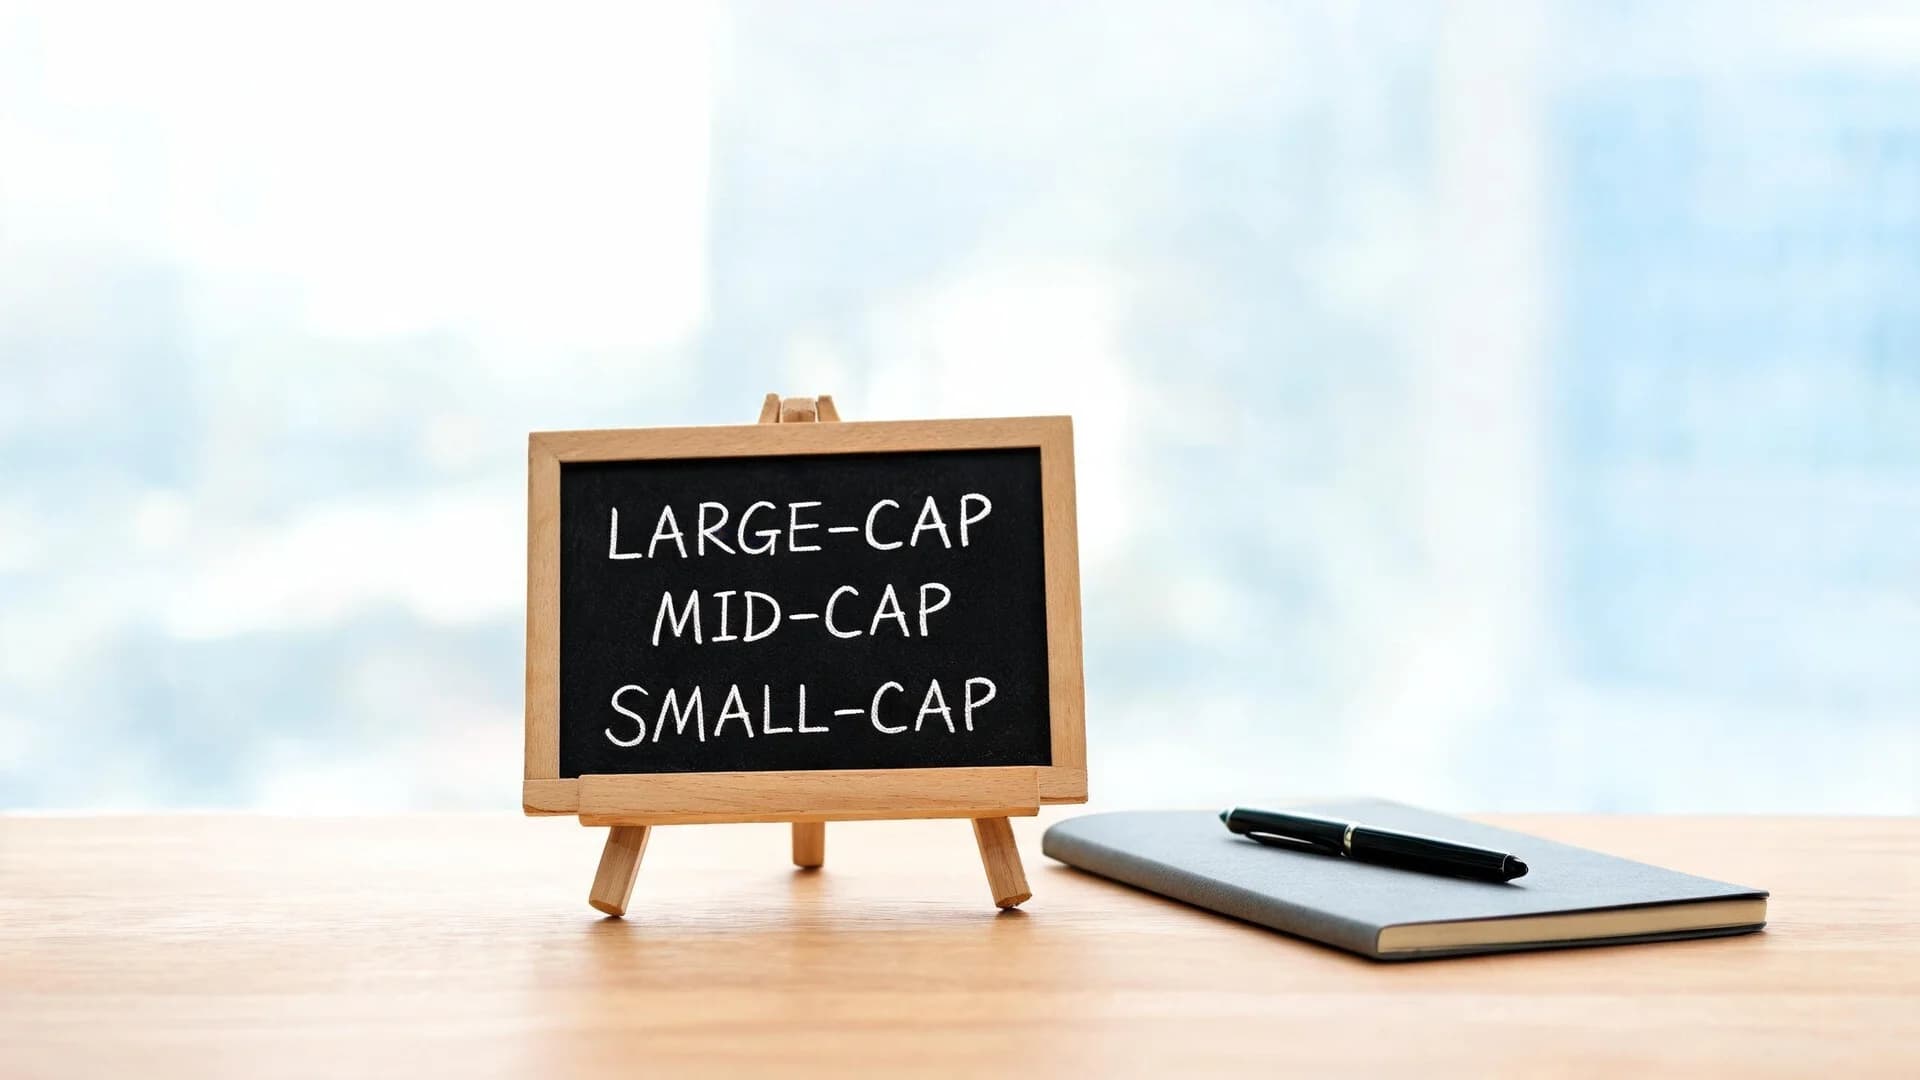
Market capitalisation sorts Indian stocks by size rather than share price, and the Nifty 50 covered 53.73% of NSE free-float market capitalisation on 30 March 2026. Market cap values outstanding shares at the traded price, while free-float market cap excludes holdings not ordinarily available for public trading. Size is the first filter most screens apply, but share price alone does not indicate it.
What does market cap mean and how is it calculated?
Market cap values a whole company by multiplying its current traded share price by every share in issue. It answers what the market says a company’s equity is worth right now.
Share price alone says nothing about size. Splitting one share into 10 does not change the company, because price and share count must be considered together. This is why size screens use market cap rather than price.
The formula is: market cap = current share price × total number of shares outstanding. A Rs 300 share is not necessarily a smaller company than a Rs 3,000 share.
The calculation uses two published inputs, which makes market cap a widely available size measure. Neither input is fixed: the price changes through the trading session, while an issue or buyback changes the number of shares.
What is free-float market cap?
Free-float market cap counts only shares actually available for public trading. NSE Indices has calculated the Nifty 50 on this basis since 26 June 2009.
Promoter holdings, government stakes and strategic blocks do not trade in the ordinary course. Including them can overstate the portion of a company that the market can actually price, while excluding them makes an index weight reflect shares genuinely available to buy.
The difference can be material. If promoters hold 75% of a company, its free float is one quarter of its full market cap, so its index influence is one quarter of what its headline size might suggest. Headline size can therefore be a poor guide to index weight.
How do I screen Indian stocks by market cap in 2026?
Set a market-cap range as the first filter, then apply other conditions within that range. The Nifty 50 covered 53.73% of NSE free-float market capitalisation as on 30 March 2026, with the rest of the market below it.
Size comes first because many other ratios behave differently across company sizes, and comparing the full market at once can mix populations that are not alike. NSE’s index structure separates these groups through indices constructed from different size bands.
Closes: NSE, as of 7 September 2026. Free-float share: NSE Indices, as on 30 March 2026.
The index levels are not size comparisons. Each level reflects its own base value and history, so the Nifty Next 50 trading above the Nifty 50 does not mean its constituent companies are larger. Current levels are published on NSE’s index tracker, while benchmark constituent detail is on Multibagg’s Nifty 50 index page.
Multibagg’s screener includes market cap as a filter across NSE- and BSE-listed companies, allowing a size range to be set before other conditions. Individual company figures are available on the stocks hub.
Got a follow-up? Ask IRIS
What are large, mid and small cap stocks, and what is India’s market-cap-to-GDP ratio?
Large, mid and small cap are size ranges used to group companies, while the market-cap-to-GDP ratio divides total listed-company market cap by the size of the economy. The size labels are used most formally in mutual fund scheme classification.
Companies are ranked by market cap and divided into bands: large cap at the top, mid cap below that and small cap beneath it. The cut-offs are refreshed periodically as company sizes change, so a company can move between bands without having done anything differently.
For screening, the labels are simply ranges on a continuous measure. A screen can use them, or it can set its own market-cap range directly and ignore the labels.
The market-cap-to-GDP ratio is expressed as a percentage and can serve as a rough gauge of how large the listed market has become relative to national output. Its numerator comes from exchange data and its denominator from national accounts, which are published on different schedules and revised at different times. The ratio can therefore vary depending on the vintage of each input, and arguments about India’s headline growth figures affect its denominator.
Why can market cap differ from a company’s worth, and what mistakes should I avoid?
Market cap prices equity at today’s share price and on the shares that exist, rather than measuring every obligation and asset of a business. The Nifty 50 closed at 23,779.15 on 7 September 2026, representing a price for its constituents’ equity and nothing else.
Debt is excluded even though a buyer of the whole business would have to assume it, and cash on the balance sheet is also excluded. The calculation also treats the last traded price as achievable across the entire holding, an assumption that can break down where trading volumes are thin.
The distinction is especially clear before a listing, when there is no traded price. Pre-listing valuation ranges are argued over rather than observed, while private-company valuations show how much the number can depend on method rather than observation.
Four errors account for most misused size screens:
- Treating a low share price as evidence of a small company. Price without share count does not show size.
- Using full market cap where free float applies. The Nifty 50 has been free-float weighted since 26 June 2009, so index influence follows tradable shares rather than total shares.
- Comparing ratios across size bands. Different populations are involved, which is why size is set before other filters.
- Assuming size bands are fixed. Classifications are refreshed periodically, so a company can change band without changing its business.
Conclusion
Market cap provides a common size measure by combining share price with shares outstanding, while free-float market cap focuses on the shares available to trade. Using a market-cap range before applying other filters helps separate companies that may otherwise be compared across unlike size groups.
The practical takeaway is to check whether a screen or index uses full or free-float market cap, and to treat large-, mid- and small-cap labels as periodically refreshed ranges rather than permanent company characteristics.
Disclaimer: This article is for informational and educational purposes only and is not investment, financial, legal or tax advice. Multibagg AI does not recommend whether to buy, sell or hold any security. Figures are as of the dates stated and may change. Consult a SEBI-registered investment adviser before making any investment decision.