










BCSSL debt-equity drops, but remains above FY26 peer median
Key highlights
- BCSSL’s debt-to-equity ratio fell from 4.31x in FY24 to 2.78x in FY26 and 2.00x in Q1FY27.
- BCSSL’s FY26 debt-to-equity ratio was 4.63 times the 0.60x peer median and the highest among the four companies compared.
- BCSSL’s FY26 EBITDA, EBIT and profit margins were 6.80%, 6.04% and 2.41%, respectively, below peer medians of 7.95%, 7.73% and 3.52%.
- BCSSL’s FY26 ROCE of 16.40% and ROE of 29.92% remained above peer medians of 13.59% and 12.71%.
powered by IRIS
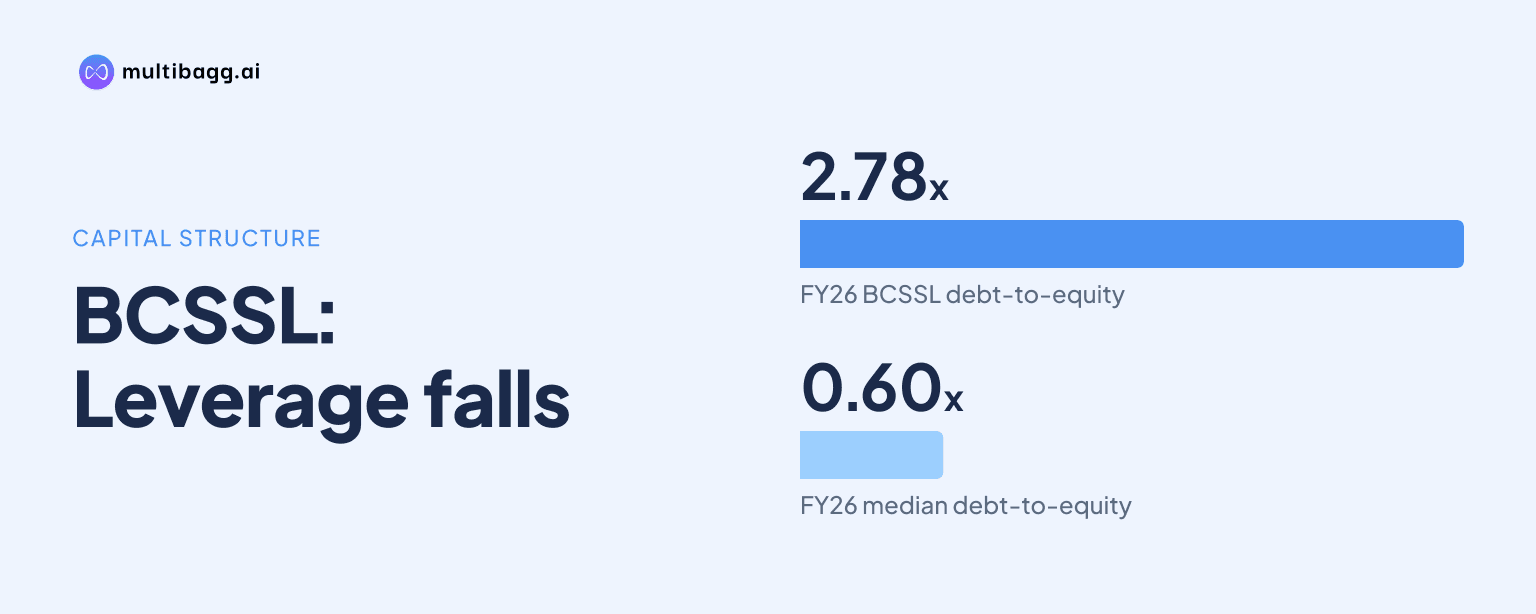
Bombay Coated and Special Steels Limited, referred to as BCSSL, reduced its debt-to-equity ratio from 4.31x in FY24 to 2.78x in FY26 and 2.00x in Q1FY27. However, BCSSL’s FY26 ratio was 4.63 times the 0.60x peer median, while its EBITDA, EBIT and profit margins were below their respective medians.
Has BCSSL reduced its debt-equity ratio?
Yes. BCSSL’s gearing ratio, defined in the peer comparison as debt to equity, declined by 1.53x from 4.31x in FY24 to 2.78x in FY26. It declined by a further 0.78x to 2.00x in Q1FY27. The supplied comparison does not disclose separate debt and equity movements, so it does not establish how much of the change came from lower borrowings or a higher equity base.
BCSSL started FY24 at a substantially higher ratio than the comparison group. The FY24 peer median was 0.93x, against BCSSL’s 4.31x; BMW Industries Limited reported 0.13x, Manaksia Coated Metals & Industries Limited reported 1.20x, and Shiv Aum Steels Limited reported 0.65x. BCSSL’s decline is therefore material in absolute terms, but it began from a higher leverage position than the three named peers.
The gap with the median narrowed from 3.38x in FY24 to 2.18x in FY26. That narrowing occurred as both BCSSL and the median declined: BCSSL moved from 4.31x to 3.33x and 2.78x, while the median moved from 0.93x to 0.72x and 0.60x. The comparison shows deleveraging at BCSSL, but not convergence with the peer group by FY26.
Why did BCSSL remain above the FY26 peer median?
BCSSL remained above the FY26 peer median because its 2.78x debt-to-equity ratio exceeded the 0.60x median by 2.18x. Expressed as a multiple, BCSSL’s FY26 ratio was about 4.63 times the median. It was also the highest FY26 ratio among the four companies shown in the peer table.
The three other FY26 ratios ranged from 0.35x to 0.78x. BMW Industries was at 0.42x after 0.13x in FY24, Manaksia Coated Metals & Industries was at 0.35x after 1.20x, and Shiv Aum Steels was at 0.78x after 0.65x. The median’s fall to 0.60x therefore reflected varied peer movements rather than a uniform change across all three companies.
BCSSL’s Q1FY27 ratio of 2.00x indicates a further reduction of 0.78x from FY26. However, the peer table marks Q1FY27 gearing ratios as not available for BMW Industries, Manaksia Coated Metals & Industries and Shiv Aum Steels. The Q1FY27 figure consequently demonstrates BCSSL’s own subsequent movement but cannot establish whether BCSSL’s relative leverage position changed against the peer median.
How do BCSSL’s margins compare with its peers?
BCSSL’s FY26 EBITDA, EBIT and profit margins were below peer medians despite 20.00% year-on-year revenue growth. EBITDA, meaning earnings before interest, tax, depreciation and amortisation, was 6.80% versus a 7.95% median. EBIT, or earnings before interest and tax, was 6.04% versus 7.73%, while profit margin was 2.41% versus 3.52%.
The gap widened in EBITDA and EBIT between FY25 and FY26. BCSSL’s EBITDA margin rose from 6.51% in FY24 to 7.02% in FY25, then fell to 6.80% in FY26; the median rose from 6.68% to 6.95% and then 7.95%. BCSSL’s EBIT margin declined from 7.17% in FY24 to 6.48% in FY25 and 6.04% in FY26, while the source attributes the moderation to capacity expansion.
BCSSL reported higher margins in Q1FY27, although they remained below available peer medians. EBITDA rose to 8.10%, compared with a 9.42% median; EBIT reached 7.37%, compared with 8.62%; and profit margin increased to 3.80%, compared with 4.60%. The Q1FY27 figures cover the three months ended June 30, 2026, so they are not directly comparable with full-year FY26 readings.
Got a follow-up? Ask IRIS
Does revenue growth explain BCSSL’s lower debt-equity ratio?
No direct explanation is disclosed, although BCSSL’s revenue grew faster than the peer median in FY26. Revenue from operations rose from Rs 755.25 crore in FY24 to Rs 1,055.71 crore in FY25 and Rs 1,266.82 crore in FY26. FY26 growth was 20.00%, above the 16.18% peer median, while the peer table reports a 29.51% compound annual growth rate for BCSSL against 10.37% for the median.
The disclosed figures do not connect revenue growth with debt repayment, fresh borrowing or equity issuance. BCSSL’s FY26 revenue exceeded the Rs 774.27 crore peer median, while BMW Industries reported Rs 664.07 crore, Manaksia Coated Metals & Industries Rs 884.46 crore and Shiv Aum Steels Rs 532.53 crore. BCSSL then reported Rs 397.08 crore of revenue from operations in Q1FY27.
Working-capital indicators provide operating-cycle context rather than a debt bridge. BCSSL’s debtor days declined from 45 in FY24 to 42 in FY25 and 38 in FY26, equal to the FY26 peer median of 38 days, before declining to 34 in Q1FY27. Net working-capital days increased from 66 in FY24 to 70 in FY26, then fell to 58 in Q1FY27; the FY26 peer median was 92 days.
Do BCSSL’s returns remain above the peer median?
Yes, BCSSL’s FY26 return on capital employed and return on equity were above peer medians, but both measures had declined from earlier periods. Return on capital employed, or ROCE, was 16.40% in FY26 against a 13.59% median. Return on equity was 29.92% against 12.71%, after BCSSL reported 48.21% in FY24 and 41.76% in FY25.
BCSSL’s ROCE increased from 18.60% in FY24 to 18.78% in FY25 before declining by 2.38 percentage points to 16.40% in FY26. It was 7.01% in Q1FY27, for which the peer table does not provide comparable figures. The higher reported return on equity and higher debt-to-equity ratio should be read together because both concern the company’s capital structure and shareholder-equity base.
Conclusion
BCSSL reduced debt-equity from 4.31x in FY24 to 2.78x in FY26, with a further decline to 2.00x in Q1FY27. The FY26 position nevertheless remained an outlier in the peer comparison: BCSSL was 2.18x above the 0.60x median and reported EBITDA, EBIT and profit margins below median levels, despite revenue growth above the peer median.
The next disclosed point to watch is whether the Q1FY27 reduction can continue while BCSSL operates four facilities with installed processing capacity of 1,23,153 metric tonnes per annum as of June 30, 2026. The source notes that air-conditioner, home-refrigeration and commercial-refrigeration order volumes are typically lower from June to September, while Q1FY27 peer gearing data remain unavailable.