










Bombay Coated Revenue Grew as Margins and Returns Declined
Key highlights
- Revenue from operations increased from Rs 755.259 crore in Fiscal 2024 to Rs 1,266.818 crore in Fiscal 2026.
- PAT margin declined from 2.80% to 2.41%, while EBIT margin fell from 7.17% to 6.04% between Fiscal 2024 and Fiscal 2026.
- Return on equity declined from 48.20% in Fiscal 2024 to 29.92% in Fiscal 2026, while ROCE fell from 18.60% to 16.40%.
- Fiscal 2026 debt-to-equity was 2.78 times, above the 0.42-times to 1.13-times range reported by its three named listed peers.
powered by IRIS
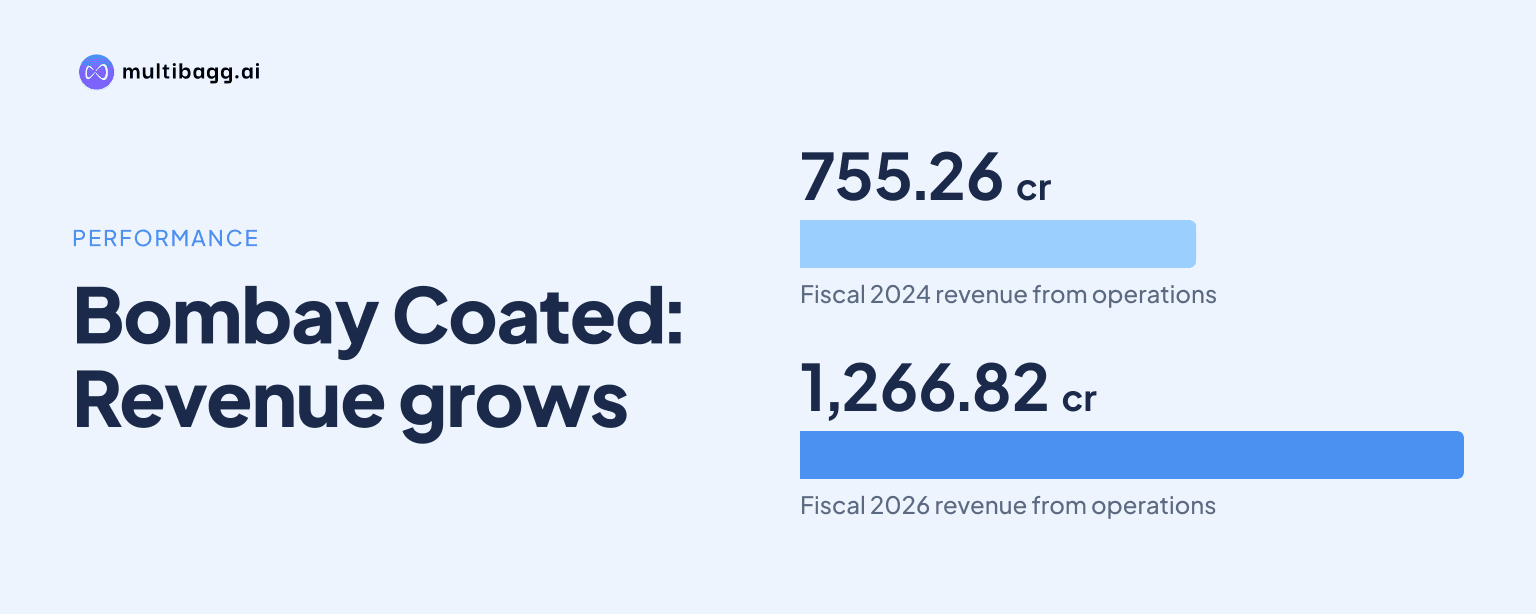
Bombay Coated and Special Steels Limited increased revenue from operations from Rs 755.259 crore in Fiscal 2024 to Rs 1,266.818 crore in Fiscal 2026, but profit after tax margin fell from 2.80% to 2.41% and return on equity declined from 48.20% to 29.92%. Bombay Coated’s Fiscal 2026 debt-to-equity ratio of 2.78 times also exceeded that of each of its three named listed peers.
Why did Bombay Coated’s revenue growth coincide with lower margins and returns?
Bombay Coated’s revenue grew in every reported fiscal year, while the proportion retained as post-tax profit declined. Revenue from operations rose by Rs 511.559 crore between Fiscal 2024 and Fiscal 2026, whereas profit after tax, or PAT, increased by Rs 9.401 crore to Rs 30.539 crore. PAT margin, calculated as PAT divided by revenue from operations, decreased by 0.39 percentage points to 2.41% over the two-year period.
The disclosed operating measures show that higher revenue did not translate into a higher earnings margin at every level. Earnings before interest and taxes, or EBIT, increased from Rs 54.169 crore in Fiscal 2024 to Rs 76.497 crore in Fiscal 2026, but EBIT margin declined from 7.17% to 6.04%. Adjusted earnings before interest, taxes, depreciation and amortisation, or adjusted EBITDA, rose from Rs 49.165 crore to Rs 86.090 crore, while adjusted EBITDA margin increased from 6.51% to 6.80%.
The key performance indicator disclosure records the margin movements but does not identify a single cause for them. EBIT is derived by adding finance costs to profit before tax, while PAT represents net profit after tax. For PAT margin to rise, a greater share of Bombay Coated’s revenue would need to be retained as post-tax profit under those reported definitions; revenue growth by itself does not establish that outcome.
How far did Bombay Coated’s returns on capital decline?
Bombay Coated’s return measures declined from Fiscal 2024 despite the increase in absolute PAT to Rs 30.539 crore in Fiscal 2026. Return on equity, or RoE, fell by 18.28 percentage points from 48.20% to 29.92%; Bombay Coated defines RoE as PAT divided by average net worth. Return on capital employed, or ROCE, moved from 18.60% to 16.40%, while return on assets, or ROA, declined from 6.81% to 5.93%.
The asset base used in operations increased during the same period. Property, plant and equipment rose from Rs 116.076 crore in Fiscal 2024 to Rs 164.198 crore in Fiscal 2026. Net fixed-asset turnover, defined as revenue from operations divided by property, plant and equipment excluding capital work-in-progress and right-of-use assets, rose from 6.51 times in Fiscal 2024 to 8.92 times in Fiscal 2025 before declining to 7.72 times in Fiscal 2026.
Bombay Coated’s Fiscal 2026 RoE of 29.92% was above BMW Industries Limited’s 10.91%, Manaksia Coated Metals & Industries Limited’s 14.51% and Shiv Aum Steels Limited’s 4.83%. Its 16.40% ROCE was below Manaksia Coated Metals & Industries Limited’s 17.40%, but above BMW Industries Limited’s 10.78% and Shiv Aum Steels Limited’s 8.08%. The peer information is presented on a standalone basis in the offer document.
Got a follow-up? Ask IRIS
Is Bombay Coated’s leverage higher than its listed peers?
Yes. Bombay Coated reported a debt-to-equity ratio of 2.78 times in Fiscal 2026, compared with 0.42 times for BMW Industries Limited, 1.13 times for Manaksia Coated Metals & Industries Limited and 0.78 times for Shiv Aum Steels Limited. Bombay Coated defines debt-to-equity as total current and non-current borrowings divided by total equity, with total equity comprising equity share capital and other equity.
Bombay Coated’s leverage ratio nevertheless moved down across the three reported fiscal years. Debt-to-equity declined from 4.31 times in Fiscal 2024 to 3.33 times in Fiscal 2025 and 2.78 times in Fiscal 2026, a reduction of 1.53 times from Fiscal 2024. The disclosure does not attribute that ratio change to a particular repayment, refinancing or equity-raising transaction.
Other balance-sheet measures show different comparisons. Bombay Coated’s current ratio, calculated as current assets divided by current liabilities, was 1.02 times in Fiscal 2026, versus 5.35 times for BMW Industries Limited, 1.91 times for Manaksia Coated Metals & Industries Limited and 34.57 times for Shiv Aum Steels Limited. Its debt-service coverage ratio was 1.75 times, while the three peers reported 0.66 times, 1.83 times and 0.19 times, respectively.
Which operating measures could affect Bombay Coated’s future ratios?
Bombay Coated expanded installed capacity in its processing lines through Fiscal 2026, although utilisation differed by activity. Slitting capacity increased from 176,958 metric tonnes in Fiscal 2024 to 238,020 metric tonnes in Fiscal 2026, and actual slitting production rose from 82,576 metric tonnes to 144,258 metric tonnes. Slitting utilisation increased from 46.66% to 60.61%, but remained below the 63.40% reported in Fiscal 2025.
Cut-to-length capacity increased from 95,063 metric tonnes in Fiscal 2024 to 184,324 metric tonnes in Fiscal 2026, while production rose from 52,995 metric tonnes to 108,276 metric tonnes. Yet cut-to-length utilisation fell from 70.75% in Fiscal 2025 to 58.74% in Fiscal 2026. Embossing utilisation also fell to 46.68% from 63.70%, and shearing utilisation declined to 59.86% from 73.41%.
For the three months ended June 30, 2026, Bombay Coated reported revenue of Rs 397.080 crore, PAT of Rs 15.075 crore and a PAT margin of 3.80%. Debt-to-equity was 2.00 times and net working-capital days were 58, compared with 70 days in Fiscal 2026. Bombay Coated states that the three-month figures are not annualised, so they cannot establish a full-year result.
Conclusion
Bombay Coated’s Fiscal 2024 to Fiscal 2026 results combine revenue growth of Rs 511.559 crore with lower PAT and EBIT margins and lower return ratios. Its debt-to-equity ratio declined over the period, but its Fiscal 2026 ratio of 2.78 times remained above each of the three named listed peers, whose profitability and capital measures also varied materially.
The next disclosed update will be Bombay Coated’s periodic KPI reporting. The company says it will disclose these indicators at least annually, or at a shorter interval decided by its board, until the later of one year after listing or complete utilisation of issue proceeds. Those disclosures can show whether the June 2026 margins, capacity utilisation, working-capital days and 2.00-times debt-to-equity ratio persist over a full reporting period.