










EAAA fee-paying AUM grows as profit margin falls to 24%
Key highlights
- EAAA’s fee-paying AUM rose 27.43% year on year to Rs 48,623.176 crore for the three months ended June 30, 2026.
- Total income increased 58.82% to Rs 336.130 crore, while profit after tax rose 44.96% to Rs 80.706 crore.
- PAT margin declined to 24.01% from 26.31% a year earlier and 29.98% in fiscal 2024.
- EAAA’s cost-to-income ratio climbed to 68.52%, compared with 63.33% in the June 2025 period.
powered by IRIS
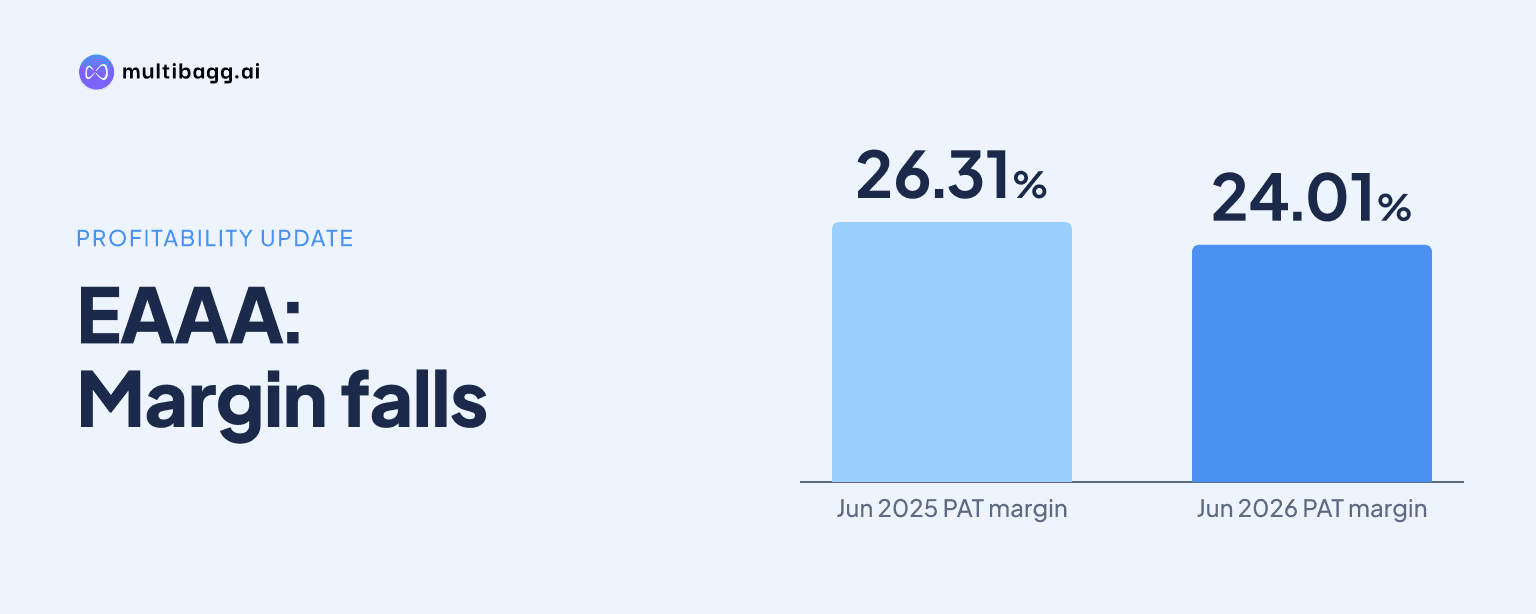
EAAA India Alternatives Limited reported fee-paying assets under management of Rs 48,623.176 crore for the three months period ended June 30, 2026, up 27.43% from Rs 38,157.217 crore a year earlier. EAAA’s profit-after-tax margin nevertheless fell to 24.01%, from 26.31% in the June 2025 period and 29.98% in fiscal 2024, as its cost-to-income ratio reached 68.52%.
Why did EAAA’s fee-paying AUM rise to Rs 48,623.176 crore?
EAAA’s fee-paying assets under management, or FPAUM, increased by Rs 10,465.959 crore year on year to Rs 48,623.176 crore in the three months period ended June 30, 2026. FPAUM means assets on which EAAA is entitled to earn management and advisory fees, and may be based on committed capital, invested capital, net asset value, gross block or another basis set out in the relevant governing documents.
EAAA’s reported FPAUM also rose across the three completed fiscal years. It increased to Rs 44,710.442 crore in fiscal 2026 from Rs 33,833.278 crore in fiscal 2025 and Rs 30,398.012 crore in fiscal 2024. The June 2026 measure was Rs 3,912.734 crore above fiscal 2026, but the company applies contractual bases that differ among funds and mandates rather than one uniform asset-value calculation.
FPAUM is EAAA’s measure of business scale and is not an Indian Accounting Standards, or Ind AS, metric. EAAA says the measure has analytical limitations and may not be comparable with similar measures used by other companies. Its conversion into management fees depends on the applicable fee rate and the committed capital, invested capital, net asset value or gross-block basis specified for each vehicle.
Did higher fee-paying AUM increase EAAA’s income?
Yes. EAAA’s management and advisory fees rose 25.71% to Rs 166.576 crore in the three months period ended June 30, 2026, from Rs 132.509 crore in the corresponding 2025 period. These are fees for management and advisory services, generally charged as a percentage of the reference base established in each fund or mandate’s governing documents.
Variable Additional Return increased 86.89% to Rs 108.953 crore from Rs 58.298 crore, while GP Income rose to Rs 55.229 crore from Rs 16.369 crore. Variable Additional Return is income earned after a fund achieves its investor hurdle rate, based on net asset value and/or realisation, and is recognised under the waterfall distribution mechanism in fund documents. GP Income is income from investments in funds or co-investments in portfolio companies on the same terms as the primary fund.
Management and advisory fees, Variable Additional Return and GP Income totalled Rs 330.758 crore, or 98.40% of EAAA’s Rs 336.130 crore total income in the June 2026 period. GP Income includes interest on debt instruments and pass-through certificates, plus net fair-value gains or losses on alternative investment funds, debt instruments, pass-through certificates and equity investments. This means that income growth depended not only on FPAUM but also on fund hurdle rates, realisations, valuations and investment performance.
Why has EAAA’s profit margin fallen despite income growth?
EAAA’s profit after tax, or PAT, increased 44.96% to Rs 80.706 crore in the three months period ended June 30, 2026, but total income increased faster, by 58.82% to Rs 336.130 crore. PAT margin, calculated as PAT divided by total income, therefore declined by 2.30 percentage points from 26.31% to 24.01%.
The disclosed cost-to-income ratio explains the arithmetic of the margin movement. This ratio divides total expenses by total income, and it increased to 68.52% in the June 2026 period from 63.33% a year earlier, a 5.19-percentage-point increase. A larger share of income was therefore absorbed by expenses, so the growth in income did not translate proportionately into PAT.
The annual trend began before the June 2026 period. EAAA’s PAT margin declined from 29.98% in fiscal 2024 to 29.21% in fiscal 2025 and 27.52% in fiscal 2026, while the cost-to-income ratio was 63.60%, 63.85% and 63.84%, respectively. The June 2026 ratio of 68.52% exceeded each of those annual readings, making the latest reported margin compression more pronounced.
Got a follow-up? Ask IRIS
How did EAAA’s June 2026 ratios compare with listed peers?
EAAA’s 24.01% PAT margin for the three months period ended June 30, 2026 was below 360 One WAM Limited’s 25.96% and above NuvaM Wealth Management Limited’s 22.12% in the disclosed peer table. The peer set covers mutual fund management, wealth management, advisory and alternative asset management, and EAAA says the businesses differ in revenue streams, operating structures and performance metrics.
EAAA’s 68.52% cost-to-income ratio was above 360 One WAM’s 66.73% and below NuvaM’s 70.47% for the same period. HDFC Asset Management Company Limited reported 20.08% and ICICI Prudential Asset Management Company Limited reported 26.61%, but EAAA identifies the peers as directionally comparable at an industry level rather than directly equivalent business models. The table provides no peer FPAUM figures, preventing a like-for-like comparison of fee-paying asset scale.
EAAA’s annualised return on equity was 28.96% in the June 2026 period, compared with 22.20% a year earlier. Return on equity is PAT divided by average net worth. Net worth increased to Rs 1,160.394 crore from Rs 1,045.650 crore, while total borrowings fell to Rs 399.197 crore from Rs 495.308 crore and debt-to-equity declined to 0.34 from 0.47.
What must change for EAAA’s margin to stabilise?
EAAA’s cost-to-income ratio must decline for a given level of income for PAT margin to rise under its disclosed definitions. In the June 2026 period, total income increased by Rs 124.481 crore year on year, but the cost-to-income ratio rose by 5.19 percentage points and PAT margin fell to 24.01%. Sustained management-fee growth would require the contractual fee-bearing bases underlying FPAUM to remain available.
The mix of income can also affect the result because Rs 108.953 crore of June 2026 Variable Additional Return depended on investor hurdle rates, net asset value and/or realisation, while Rs 55.229 crore of GP Income includes fair-value movements. EAAA had Rs 247.322 crore of cash and cash equivalents including bank balances, Rs 399.197 crore of total borrowings and Rs 2,101.839 crore of total assets at June 30, 2026. The prospectus does not attribute margin compression to any individual balance-sheet item.
EAAA has confirmed that it will disclose the KPIs periodically at least once a year for one year after listing, or at a shorter interval decided by its board or required under Securities and Exchange Board of India regulations. The next disclosure can show whether management-fee growth, performance-linked income and expenses change the 68.52% cost-to-income ratio.
Conclusion
EAAA’s larger fee-paying asset base supported higher management and advisory fees, Variable Additional Return and total income in the June 2026 period. FPAUM reached Rs 48,623.176 crore and PAT rose to Rs 80.706 crore, but expenses took a larger share of income, reducing PAT margin to 24.01% from 29.98% in fiscal 2024.
The next KPI update will show whether the June 2026 cost-to-income ratio of 68.52% persists and whether performance-linked revenue continues to contribute to income. EAAA’s disclosed plan to report these KPIs at least annually for one year after listing provides the stated basis for monitoring that unresolved margin question.