










HGS export share rose to 84% of FY26 revenue from 59% in FY25
Key highlights
- HGS exports accounted for 84.22% of FY26 revenue, up from 59.15% in FY25.
- Export revenue increased to Rs 38.04 crore from Rs 29.03 crore, while domestic revenue declined to Rs 7.12 crore from Rs 20.05 crore.
- The United States, Norway, Germany and Sweden together contributed Rs 27.82 crore, or 61.60% of FY26 revenue.
- HGS’s top 10 customers accounted for 72.58% of FY26 revenue, up from 56.24% in FY25.
powered by IRIS
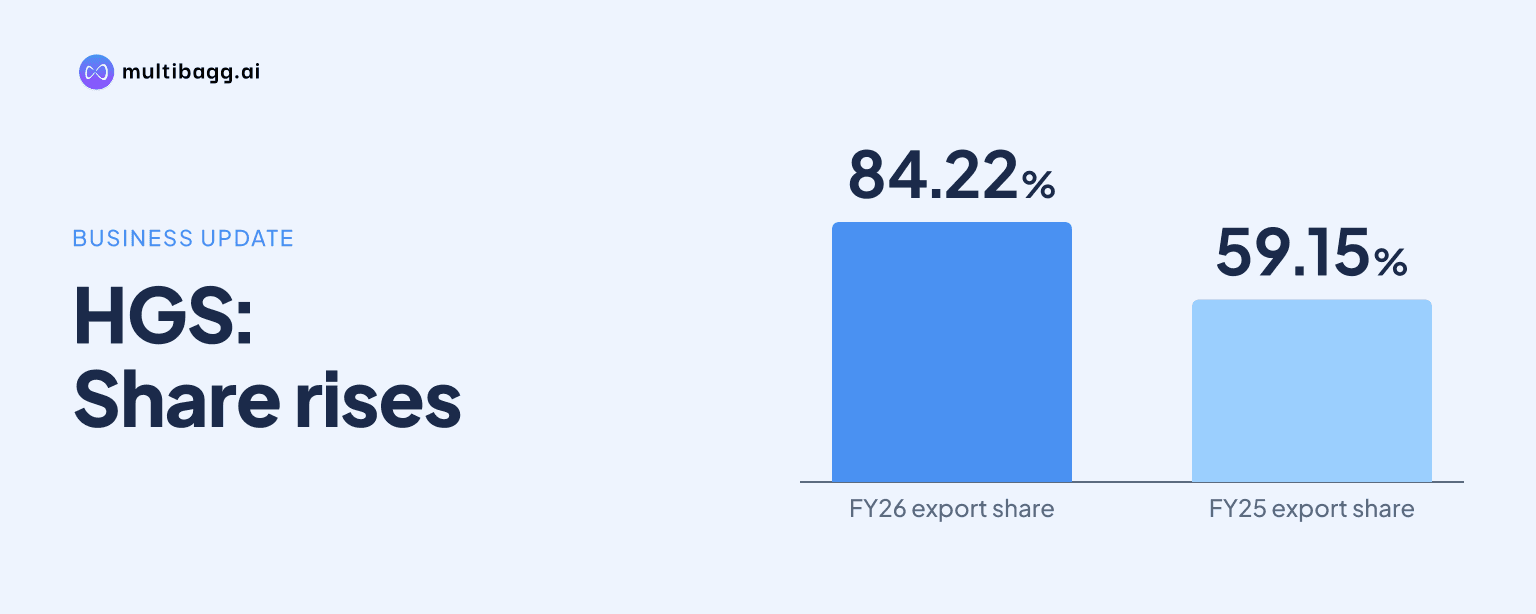
HGS derived 84.22% of revenue from exports in FY26, compared with 59.15% in FY25, according to its sales bifurcation. Export revenue rose to Rs 38.04 crore while domestic revenue fell to Rs 7.12 crore, shifting HGS’s reported revenue mix sharply towards overseas customers.
How did HGS exports reach 84% of FY26 revenue?
HGS exports reached 84.22% of FY26 revenue because export sales increased while domestic sales contracted. Export revenue was Rs 38.04 crore in FY26, against Rs 29.03 crore in FY25, an increase of Rs 9.01 crore. Domestic revenue declined by Rs 12.92 crore to Rs 7.12 crore from Rs 20.05 crore over the same period.
The resulting change was substantial in both percentage-point and rupee terms. Export share rose by 25.07 percentage points from 59.15% in FY25 to 84.22% in FY26, while domestic share dropped to 15.78% from 40.85%. Total revenue in the export-and-domestic table declined from Rs 49.08 crore in FY25 to Rs 45.16 crore in FY26, meaning the export-share expansion did not arise from overall revenue growth.
The FY26 mix also differed from FY24, when exports represented 63.17% of revenue and domestic sales represented 36.83%. Export revenue in FY24 was Rs 22.41 crore and domestic revenue was Rs 13.06 crore, out of total revenue of Rs 35.48 crore. HGS therefore reported an export share 21.05 percentage points higher in FY26 than in FY24, alongside a domestic share below half its FY24 level.
Which overseas markets drove HGS export revenue in FY26?
The United States, Norway, Germany and Sweden were HGS’s four largest named overseas markets in FY26. The United States generated Rs 10.92 crore, Norway Rs 6.14 crore, Germany Rs 5.43 crore and Sweden Rs 5.33 crore. Together, those four countries accounted for Rs 27.82 crore, equal to 61.60% of the Rs 45.16 crore total reported in the export-and-domestic revenue table.
The United States was the largest individual geography at 24.19% of FY26 revenue, up from 10.28% in FY25. Norway accounted for 13.58% in FY26, compared with 4.74% in FY25. Germany increased to 12.02% from 9.92%, while Sweden rose to 11.81% from 10.13%. These four markets supplied much of the increase in overseas revenue, although HGS reported sales across a wider set of countries.
The geographic data also show changes outside the four leading export destinations. Sales to the United Kingdom fell to Rs 83.97 lakh in FY26 from Rs 4.80 crore in FY25, reducing its share to 1.86% from 9.78%. India was the domestic market in the sales bifurcation, and its revenue declined to Rs 7.12 crore in FY26 from Rs 20.05 crore in FY25, accounting for most of the reduction in domestic sales.
HGS reported that its portfolio was sold in around 47 countries including India as of April 30, 2026. Its FY26 revenue table also included Rs 4.59 crore in “Others,” covering countries including France, Italy, Singapore, Poland, Bangladesh, Belgium, Malaysia, the United Arab Emirates and Japan. That category represented 10.31% of FY26 revenue, so named country figures do not capture every export destination.
Got a follow-up? Ask IRIS
What does the European hub mean for HGS’s overseas sales?
HGS’s stated overseas model combines Indian manufacturing with marketing and customer engagement in Europe, supporting an export share of 84.22% in FY26. Its wholly owned subsidiary, HGS Products B.V., Netherlands, serves as a centre for marketing activities and customer engagement in developed markets. HGS says this “Dual-Hub” model is intended to align the company with technological standards, customer specifications and regulatory requirements in key international geographies.
The Netherlands itself contributed Rs 2.13 crore, or 4.72%, of FY26 revenue, compared with Rs 63.02 lakh, or 1.29%, in FY25. The disclosure describes HGS Products B.V. as a marketing and engagement centre, rather than stating that Netherlands revenue represents only sales generated by that subsidiary. The country revenue figure should therefore not be treated as a measure of the subsidiary’s operating contribution.
HGS states that its Manesar, Haryana manufacturing facility supports cost-efficient and scalable production, while proximity to New Delhi International Airport facilitates global logistics and rapid shipment of seismic equipment. The company is recognised as a 100% Export Oriented Unit by the Noida Special Economic Zone. The export-led model depends on continued overseas demand, workable international logistics and the company’s ability to meet customer specifications across multiple markets.
How concentrated and variable is HGS’s revenue base?
HGS’s revenue was concentrated among a limited number of customers in FY26 as well as being more export-oriented. Its top customer contributed Rs 9.84 crore, or 21.79%, of FY26 revenue. Its top five customers generated Rs 27.19 crore, or 60.21%, and its top 10 customers generated Rs 32.78 crore, or 72.58%.
Customer concentration increased from FY25. The top customer’s share rose from 9.96% in FY25 to 21.79% in FY26, while the top five customers’ share increased from 37.11% to 60.21%. The top 10 customers’ share increased from 56.24% to 72.58%. HGS sold products to 149 domestic and foreign customers in FY26 and received repeat orders from around 51 customers during the preceding three fiscal years.
The distribution of country sales changed markedly across the three reported fiscal years. Brazil accounted for Rs 4.22 crore, or 11.90%, in FY24, but fell to Rs 23.22 lakh, or 0.51%, in FY26. Conversely, Norway rose from Rs 83,000 in FY24 to Rs 6.14 crore in FY26. These movements show that HGS’s export exposure is spread across many countries but that individual markets can become material or diminish between reporting periods.
There is a disclosure reconciliation issue in the FY26 geographic table. The listed country table reports a grand total of Rs 54.17 crore for FY26, while HGS’s product-category table and export-and-domestic bifurcation each report FY26 total revenue of Rs 45.16 crore. The country rows, including the stated “Others” amount of Rs 4.59 crore, should therefore be read with that inconsistency in mind; the 84.22% export share is drawn from the separate export-and-domestic table.
Conclusion
HGS’s FY26 revenue composition became decisively export-led: exports increased by Rs 9.01 crore and made up 84.22% of reported revenue, while domestic sales fell by Rs 12.92 crore. The United States, Norway, Germany and Sweden together represented 61.60% of the FY26 total in the country table, linking the company’s sales mix more closely to a limited group of overseas markets and large customers.
The next disclosed direction is expansion in both overseas and domestic markets. HGS proposes to strengthen relationships with international customers and enter new geographies, while also seeking to increase domestic seismic-equipment sales under the Government of India’s Make-in-India initiative. Readers should also watch whether later disclosures reconcile the Rs 54.17 crore FY26 geographic-table total with the Rs 45.16 crore FY26 total used in the export-and-domestic split.