










Maxwell Engineering Solutions Limited: 85% FY26 revenue was exports
Key highlights
- Exports generated Rs 24.95 crore, or 84.73%, of Maxwell Engineering’s FY26 revenue from operations of Rs 29.45 crore.
- Germany was the largest FY26 country market at Rs 6.81 crore, while Germany, the United States and the Netherlands contributed 52.05% of total revenue.
- Exports accounted for 84.34% of Rs 11.88 crore in revenue during the four-month period ended July 31, 2026.
- Manufacturing contributed Rs 18.50 crore, or 62.84%, of FY26 revenue, as the company began operations at its Waghodia facility on July 1, 2025.
powered by IRIS
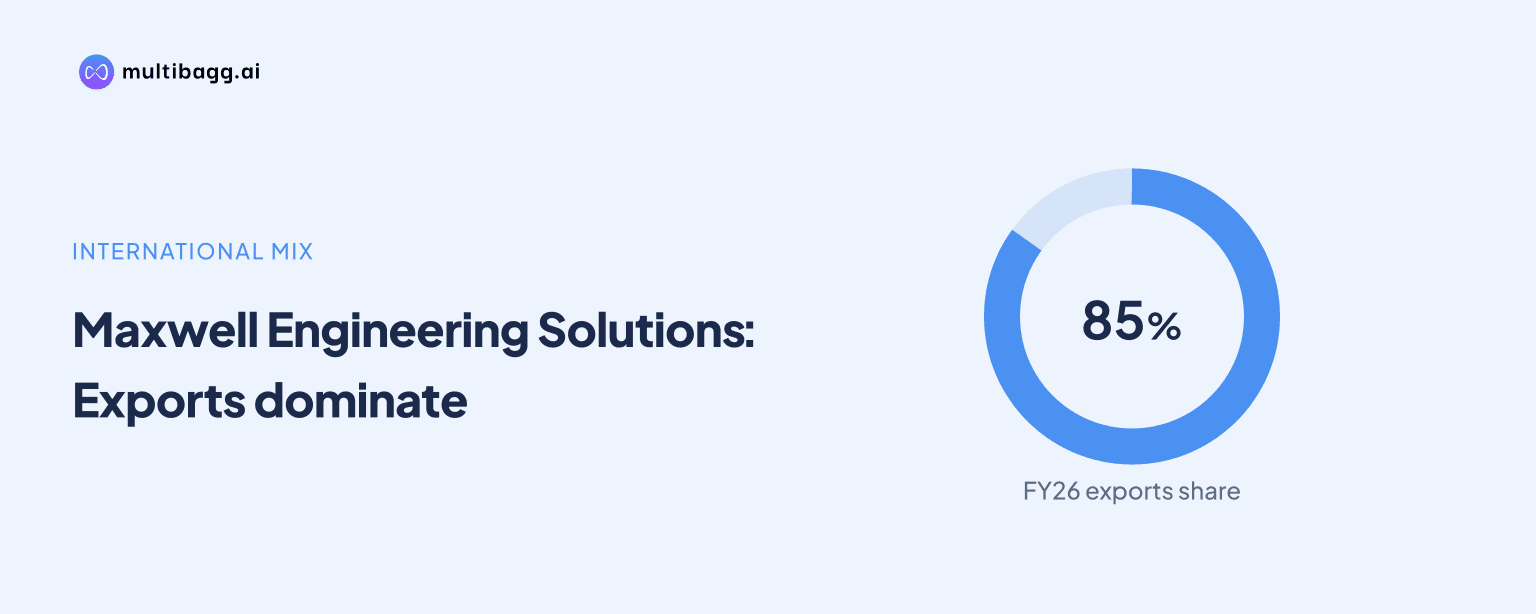
Maxwell Engineering derived Rs 24.95 crore, or 84.73%, of FY26 revenue from exports, making overseas demand its principal revenue driver. Germany was Maxwell Engineering’s largest country market at Rs 6.81 crore, while Germany, the United States and the Netherlands together produced 52.05% of FY26 revenue from operations.
How much FY26 revenue did Maxwell Engineering derive from exports?
Maxwell Engineering derived 84.73% of revenue from operations from exports in FY26, compared with 82.43% in FY25 and 80.38% in FY24. Export sales rose to Rs 24.95 crore in FY26 from Rs 18.22 crore in FY25, while total revenue from operations increased 33.25% to Rs 29.45 crore from Rs 22.10 crore. The export share therefore rose by 2.30 percentage points over FY25 and by 4.35 percentage points over FY24.
Domestic sales were Rs 4.50 crore, or 15.27% of FY26 revenue, versus Rs 3.88 crore, or 17.57%, in FY25. Domestic revenue increased in rupee terms, but its share declined as export sales expanded faster. This mix means Maxwell Engineering’s revenue trajectory remains substantially linked to overseas orders for critical components used in underwater pelletizing systems, which convert material into pellets.
Which overseas markets accounted for Maxwell Engineering’s FY26 sales?
Germany was Maxwell Engineering’s largest overseas market in FY26, contributing Rs 6.81 crore, or 23.12% of total revenue from operations. The United States ranked second at Rs 4.36 crore, or 14.80%, and the Netherlands ranked third at Rs 4.16 crore, or 14.13%. Those three markets combined accounted for Rs 15.33 crore, equal to 52.05% of FY26 revenue and 61.44% of export sales.
The country mix changed from FY25. Germany revenue was almost unchanged at Rs 6.81 crore in FY26 from Rs 6.81 crore in FY25, but its share of total revenue fell from 30.80% as Maxwell Engineering’s revenue grew. Netherlands revenue increased to Rs 4.16 crore from Rs 2.64 crore, lifting its revenue share by 2.17 percentage points. United States revenue increased to Rs 4.36 crore from Rs 4.13 crore, although its share fell by 3.90 percentage points.
Austria was the fourth-largest country market at Rs 2.91 crore, or 9.90% of FY26 revenue, followed by Israel at Rs 2.47 crore, or 8.38%. Germany, the United States, the Netherlands, Austria and Israel generated Rs 20.71 crore, or 70.33% of FY26 revenue. This reported concentration means that continued export-led revenue growth depends materially on demand across a relatively limited group of overseas country markets.
What does the July 2026 revenue mix show?
Maxwell Engineering’s export dependence remained at 84.34% in the four-month period ended July 31, 2026, close to the FY26 proportion of 84.73%. Exports were Rs 10.02 crore out of total revenue from operations of Rs 11.88 crore, while local sales were Rs 1.86 crore. The comparable percentage indicates that the overseas-led mix persisted after the March 31, 2026 financial year-end, although the filing labels July 31, 2026 as a period rather than a full financial year.
Germany accounted for Rs 3.58 crore, or 30.17%, of revenue in the period ended July 31, 2026, becoming more prominent than its 23.12% FY26 share. The Netherlands generated Rs 2.43 crore, or 20.44%, while Austria generated Rs 1.01 crore, or 8.49%. United States revenue was Rs 44.22 lakh, or 3.72%, substantially below its 14.80% FY26 share; the disclosed data do not state why this country mix changed over the partial period.
The three largest country markets in the period, Germany, the Netherlands and Austria, contributed Rs 7.02 crore, or 59.10% of revenue. That is a higher concentration than the 52.05% contributed by Germany, the United States and the Netherlands in FY26, but the two combinations are not identical because Austria replaced the United States among the largest period contributors.
Got a follow-up? Ask IRIS
How does Maxwell Engineering’s product mix support export revenue?
Pelletizing die plates were Maxwell Engineering’s largest product category in FY26, generating Rs 16.34 crore, or 55.48% of revenue from operations. Pelletizing blades and knives contributed Rs 5.94 crore, or 20.17%, while refurbishing and repair services supplied Rs 5.16 crore, or 17.51%. The filing describes die plates as components through which softened or melted material is forced and cut into pellets by rotating blades or knives.
The FY26 product mix changed from FY25 as die plates increased from 51.22% to 55.48% of revenue and blades and knives increased from 19.17% to 20.17%. Refurbishing and repair services declined as a proportion from 23.05% to 17.51%, despite increasing in value from Rs 5.09 crore to Rs 5.16 crore. Export growth therefore coincided with a larger contribution from the two principal manufactured component categories.
Manufacturing represented Rs 18.50 crore, or 62.84%, of FY26 revenue by business segment, compared with 51.06% in FY25. Trading accounted for Rs 5.33 crore, or 18.11%, down from 23.66%, and services accounted for Rs 5.61 crore, or 19.05%, down from 25.28%. Maxwell Engineering commenced operations at its company-owned Waghodia, Vadodara manufacturing facility on July 1, 2025 and has stated that it expects progressively to reduce dependence on trading activities as manufacturing capability expands.
What should readers watch in Maxwell Engineering’s revenue mix?
The central factor to watch is whether export growth remains broad enough to support a revenue base in which exports supplied Rs 24.95 crore of FY26’s Rs 29.45 crore total. Germany, the United States and the Netherlands were responsible for more than half of FY26 revenue, while the top 10 customers together represented Rs 19.35 crore, or 65.71%, of the same year’s total revenue. The filing does not identify these customers by name in the supplied data.
A second factor is the disclosed transition toward manufacturing. Maxwell Engineering reported manufacturing revenue of Rs 18.50 crore in FY26 and stated that the new facility is expected to strengthen production capability, improve operational efficiencies and progressively reduce trading dependence. Whether that plan changes the geographic mix is unresolved in the filing, because Maxwell Engineering provides no forecast for country-level sales or export share.
Conclusion
Maxwell Engineering’s FY26 revenue mix was principally export-led: exports accounted for 84.73% of Rs 29.45 crore in revenue from operations, and three countries generated 52.05%. Germany remained the largest individual market at Rs 6.81 crore, while the Netherlands gained share and the United States remained the second-largest country contributor for the full year.
The next disclosed update to assess is the continuation of this pattern after July 31, 2026, when exports remained 84.34% of Rs 11.88 crore in revenue and Germany’s share rose to 30.17%. Readers should also watch Maxwell Engineering’s stated plan to expand manufacturing at its facility operational from July 1, 2025 and to reduce reliance on trading activities, alongside any later disclosure on country and customer concentration.