










Vedant Poly Fabs faces sharply higher counterparty concentration
Key highlights
- Vedant Poly Fabs’ top 10 suppliers accounted for 90.16% of purchases in FY2026, up from 35.13% in FY2024.
- Vedant Poly Fabs’ top 10 customers generated 69.44% of FY2026 sales, up from 13.49% in FY2024.
- Purchases from the top 10 suppliers increased from Rs 16.80 crore in FY2024 to Rs 88.29 crore in FY2026.
- Vedant Poly Fabs reported Rs 46.82 crore of total debt and Rs 31.25 crore of cash credit or overdraft borrowings as at March 31, 2026.
powered by IRIS
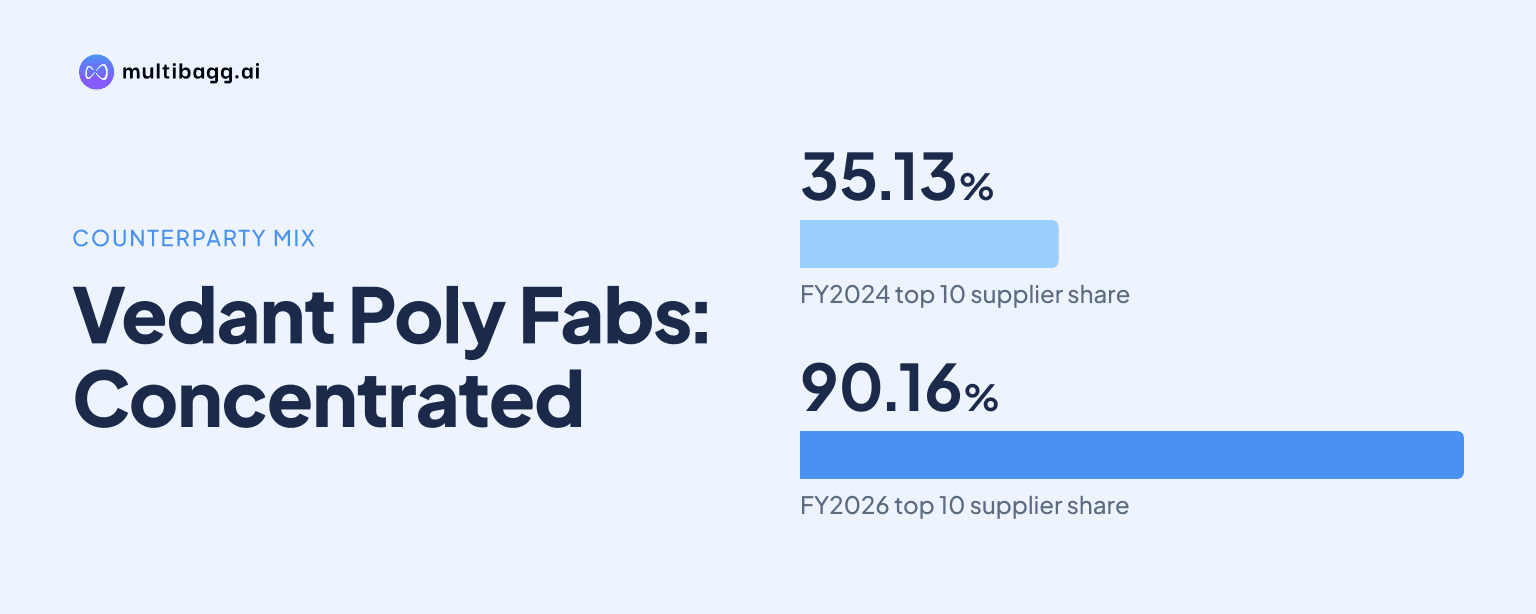
Vedant Poly Fabs Limited says its income is not dependent on a single supplier, customer or a few counterparties, but its disclosed concentration rose sharply by FY2026. Vedant Poly Fabs’ top 10 suppliers accounted for 90.16% of purchases and its top 10 customers generated 69.44% of sales in the year ended March 31, 2026.
Is Vedant Poly Fabs reliant on a few counterparties?
Yes, Vedant Poly Fabs’ aggregate disclosures show substantially greater reliance on a limited group of suppliers and customers in FY2026 than in FY2024. The top 10 suppliers represented 90.16% of FY2026 purchases, while the top 10 customers represented 69.44% of FY2026 sales. Those figures contrast with the company’s statement that no supplier or customer contributes a significant portion of its business.
The disclosures do not establish dependence on any one identified company. Vedant Poly Fabs reports only combined purchase and sales amounts for its top five and top 10 counterparties, without names or individual shares. The company’s statement addresses a single supplier or customer, or a few counterparties, whereas the tables measure collective exposure to groups of five and 10.
The distinction is material because the top-10 measures nevertheless show where purchasing and sales activity was concentrated in the year ended March 31, 2026. A 90.16% top-10 supplier share means most procurement came from 10 suppliers, while a 69.44% top-10 customer share means that 10 customers accounted for nearly seven-tenths of sales. The prospectus does not disclose contract duration, replacement suppliers, customer retention arrangements or payment performance for those counterparties.
How sharply did Vedant Poly Fabs’ supplier concentration rise?
Vedant Poly Fabs’ top-10 supplier share rose to 90.16% of purchases in FY2026 from 35.13% in FY2024, an increase of 55.03 percentage points. The top-five supplier share also rose, from 32.96% in FY2024 to 79.32% in FY2026. The reported pattern shows procurement becoming more concentrated as measured by the purchase share held by the largest supplier groups.
The rise occurred alongside higher purchases from the largest groups, rather than solely because of a lower purchase base. Purchases from the top 10 suppliers increased from Rs 16.80 crore in FY2024 to Rs 88.29 crore in FY2026. The difference between the top-five and top-10 supplier shares was 10.84 percentage points in FY2026, indicating that suppliers ranked sixth through 10th collectively represented that portion of total purchases.
The FY2026 supplier figures also show a faster shift after FY2025. The top-10 share increased from 53.24% in FY2025 to 90.16% in FY2026, while the top-five share rose from 49.70% to 79.32%. For this concentration level to persist, Vedant Poly Fabs would need to continue placing most purchases with the same leading supplier group or grow purchases from that group faster than purchases from other suppliers.
How concentrated were Vedant Poly Fabs’ customer sales?
Vedant Poly Fabs’ top 10 customers generated 69.44% of sales in FY2026, compared with 13.49% in FY2024. Its top five customers generated 59.97% of FY2026 sales, up from 8.94% two years earlier. The customer concentration increase was therefore most pronounced among the five largest customer relationships.
Sales to the top 10 customers increased from Rs 6.68 crore in FY2024 to Rs 79.95 crore in FY2026. Their share of sales increased by 55.95 percentage points over the same period. The top-five customer share rose by 51.03 percentage points, which means most of the growth in top-10 concentration was represented by the five largest customers rather than customers ranked sixth through 10th.
Customers ranked sixth through 10th accounted for 9.47% of FY2026 sales, calculated from the disclosed difference between the 69.44% top-10 share and the 59.97% top-five share. That calculation does not reveal the contribution of any individual customer. Vedant Poly Fabs therefore provides evidence of aggregate concentration, but not evidence that one named customer accounted for a specified share of FY2026 revenue.
Got a follow-up? Ask IRIS
What operational exposure follows from the concentration data?
Vedant Poly Fabs’ FY2026 figures indicate greater exposure to changes affecting a limited set of counterparties than the FY2024 figures did. With 90.16% of purchases coming from the top 10 suppliers, changes in availability, pricing, credit terms or delivery timing among those suppliers could affect procurement. With 69.44% of sales coming from the top 10 customers, changes in orders, payment timing or commercial terms among those customers could affect sales flows.
The prospectus does not report missed deliveries, supplier defaults, customer payment defaults, contract cancellations or customer losses. It also does not state that a leading supplier or customer is irreplaceable. The disclosed figures therefore support an assessment of higher concentration, not a finding that disruption has occurred or that any particular counterparty relationship will fail.
The exposure is relevant to working-capital execution because Vedant Poly Fabs reported total debt of Rs 46.82 crore as at March 31, 2026. Of that amount, Rs 31.25 crore was cash credit or overdraft borrowing. The debt data does not show that concentration caused borrowings, but it places procurement and sales concentration within a business using bank funding for working capital.
How does the concentration coincide with Vedant Poly Fabs’ expansion?
Vedant Poly Fabs’ concentration disclosures follow a change in the revenue mix reported for FY2025. Revenue from operations was Rs 81.02 crore in FY2025, including Rs 50.84 crore from manufacturing activity and Rs 30.18 crore from trading activity. Manufacturing represented 62.75% of FY2025 revenue from operations, compared with 43.88% in FY2024.
Trading activity represented 37.25% of FY2025 revenue from operations, down from 56.12% in FY2024. Vedant Poly Fabs reported manufacturing revenue of Rs 21.74 crore in FY2024 and described FY2025 manufacturing revenue growth as 133.89%. The supplied disclosures do not link the manufacturing shift to specific suppliers or customers, so the data cannot show whether the concentration arose from the change in revenue mix.
Vedant Poly Fabs also reported cash and cash equivalents of Rs 7.55 crore at March 31, 2026, compared with Rs 50.13 lakh at March 31, 2025. Net cash used in operating activities was Rs 11.46 crore in FY2026, while net cash from financing activities was Rs 47.16 crore. These figures show that expansion and counterparty concentration occurred during a period of substantial financing inflows, without proving a causal connection.
Conclusion
Vedant Poly Fabs’ top-10 supplier share increased from 35.13% in FY2024 to 90.16% in FY2026, while its top-10 customer share increased from 13.49% to 69.44%. The company’s statement that it is not dependent on a single supplier, customer or a few counterparties is not disproved by the tables, but the aggregate data shows far greater concentration in its largest supplier and customer groups.
The next disclosures to watch are whether purchase and sales shares become less concentrated as operations develop. Vedant Poly Fabs states that expected operating cash generation, fresh-issue proceeds and existing bank loans should meet working-capital, capital-expenditure and general-corporate requirements for 12 months after the Draft Red Herring Prospectus; continuity in the supplier and customer relationships represented in FY2026 will be relevant to that plan.