










Kenrik Industries receivables fall as payables quadruple
Key highlights
- Kenrik Industries' trade receivables fell by Rs 1.44 crore to Rs 11.81 crore at 30 September 2026.
- Trade payables to other creditors rose by Rs 1.83 crore to Rs 2.37 crore in six months.
- Kenrik Industries generated Rs 24.05 lakh of net operating cash in the six months ended 30 September 2026.
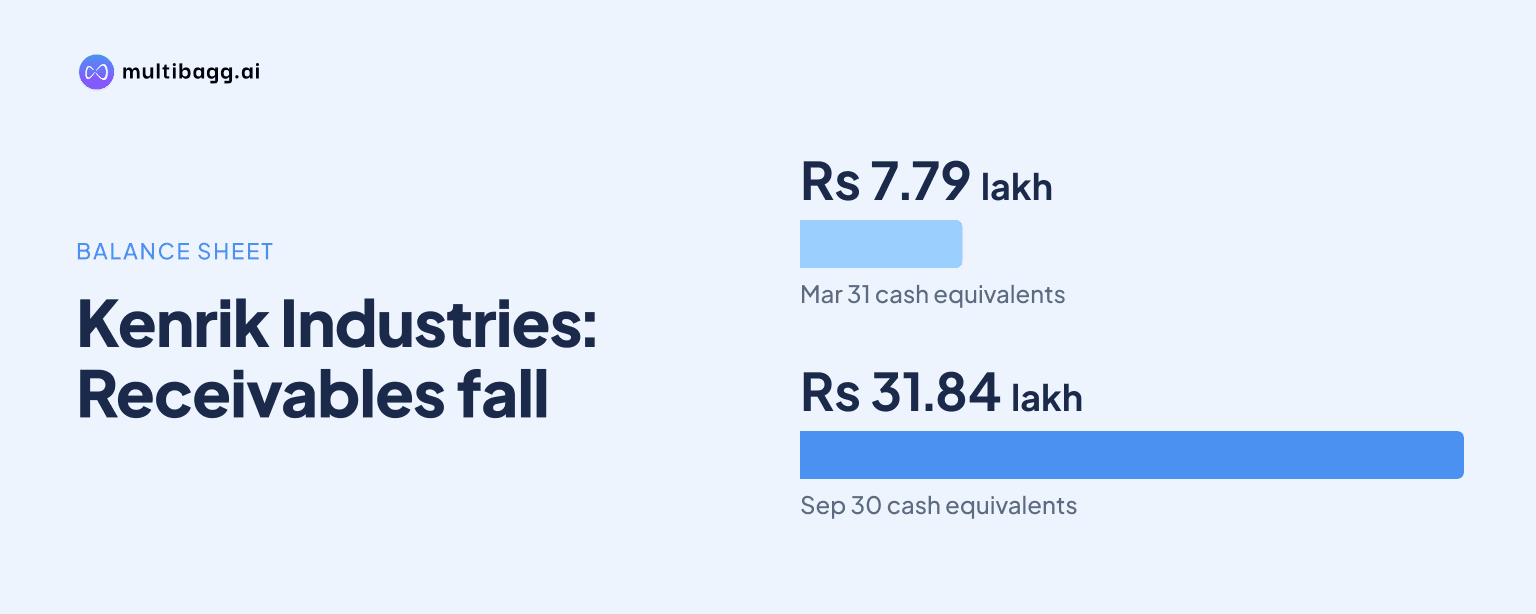
- Cash and cash equivalents increased to Rs 31.84 lakh from Rs 7.79 lakh at 31 March 2026.
powered by IRIS
Kenrik Industries Limited reduced trade receivables to Rs 11.81 crore at 30 September 2026 from Rs 13.25 crore at 31 March 2026, while trade payables to creditors other than micro and small enterprises rose to Rs 2.37 crore from Rs 53.73 lakh over the same six months.
Know Kenrik Industries inside out
Results, valuation, peers and who's buying, in one view.
How did Kenrik Industries' working capital change by September 2026?
Kenrik Industries' current assets fell to Rs 24.85 crore at 30 September 2026 from Rs 26.37 crore at 31 March 2026, while current liabilities declined to Rs 2.56 crore from Rs 4.07 crore. The reduction in receivables, inventories and other current assets coincided with higher trade payables and lower other current liabilities.
Trade receivables produced the largest asset movement, declining by Rs 1.44 crore to Rs 11.81 crore. The cash-flow statement records a Rs 1.45 crore decrease in trade receivables for the six months, broadly matching the balance-sheet comparison and showing that the amount outstanding from customers was lower at the half-year end.
Inventories decreased by Rs 13.07 lakh to Rs 12.59 crore, while other current assets fell to Rs 13.65 lakh from Rs 30.97 lakh. Cash and cash equivalents moved in the other direction, increasing by Rs 24.05 lakh to Rs 31.84 lakh from Rs 7.79 lakh.
Why did Kenrik Industries' trade payables more than quadruple?
Kenrik Industries reported trade payables of Rs 2.37 crore to creditors other than micro and small enterprises at 30 September 2026, an increase of Rs 1.83 crore from Rs 53.73 lakh at the March year-end. The September balance was more than four times the earlier amount, while dues to micro enterprises and small enterprises were nil at both reporting dates.
The balance-sheet movement differs from the cash-flow statement, which records a Rs 1.53 crore increase in trade payables during the six months ended 30 September 2026. Kenrik Industries did not provide a reconciliation between the Rs 1.83 crore change implied by its two balance sheets and the Rs 1.53 crore cash-flow movement.
Current borrowings were unchanged at Rs 11.60 lakh at both 30 September 2026 and 31 March 2026, and non-current borrowings were nil at both dates. The filing therefore reports higher creditor dues without a corresponding increase in the stated current-borrowing balance, but does not disclose supplier terms or transactions behind the payable increase.
Did lower receivables convert into operating cash for Kenrik Industries?
Kenrik Industries generated net operating cash of Rs 24.05 lakh in the six months ended 30 September 2026, compared with profit before tax of Rs 81,000. Operating profit before working-capital changes was Rs 1.40 lakh, meaning reported cash generation was shaped principally by movements in operating assets and liabilities.
The cash-flow statement shows a Rs 1.45 crore benefit from lower receivables, a Rs 13.07 lakh benefit from lower inventories, and a Rs 1.53 crore benefit from higher trade payables. These positive movements were more than offset by a reported Rs 3.07 crore decrease in other liabilities, alongside Rs 17.32 lakh of lower loans and advances.
After Rs 20,000 of income-tax payment, Kenrik Industries reported Rs 24.05 lakh of cash generated from operations. It reported no investing or financing cash flow for the period, so cash and cash equivalents increased by the same Rs 24.05 lakh from the beginning-of-year balance of Rs 7.79 lakh.
Got a follow-up? Ask IRIS
What changed in Kenrik Industries' other liabilities?
Kenrik Industries' total liabilities declined to Rs 2.56 crore at 30 September 2026 from Rs 4.07 crore at 31 March 2026, despite the Rs 1.83 crore increase in trade payables. The reported fall in total liabilities indicates that reductions in other current-liability categories outweighed the increase in creditor dues.
Other current liabilities stood at Rs 1.98 lakh at 30 September 2026, compared with Rs 1.09 crore at 31 March 2026. Provisions were Rs 4.95 lakh at the September date, while the comparative figure displayed in the statement was Rs 1.53 lakh; the filing gives no narrative explanation for the cash-flow statement's separate Rs 3.07 crore decrease in other liabilities.
Total equity was Rs 22.34 crore at 30 September 2026, marginally above Rs 22.33 crore at 31 March 2026. Equity share capital remained Rs 12.50 crore, other equity was Rs 9.85 crore, and the company reported nil non-current liabilities at both balance-sheet dates.
What business activity sits behind Kenrik Industries' balances?
Kenrik Industries identifies trading in gold, silver ornaments and bullion as its sole reportable primary business segment under Indian Accounting Standard 108, Operating Segments. Revenue from operations was Rs 111.25 crore for the half year ended 30 September 2026, versus Rs 58.06 crore for the half year ended 31 March 2026 and Rs 22.13 crore for the half year ended 30 September 2025.
Cost of materials consumed was Rs 111.19 crore in the September 2026 half year, close to the Rs 111.25 crore revenue figure. Kenrik Industries reported profit after tax of Rs 61,000, compared with a Rs 58.83 lakh loss in the half year ended 31 March 2026, but the filing does not directly link revenue, collections or supplier credit to the working-capital movements.
The board approved the unaudited half-year results on 6 November 2026 after audit committee review. V S S B & Associates issued a limited review report stating that nothing had come to its attention indicating required information had not been disclosed or that the statements contained a material misstatement; the report also states that a review is narrower than an audit.
Conclusion
Kenrik Industries ended September 2026 with Rs 1.44 crore lower receivables, Rs 13.07 lakh lower inventories and Rs 24.05 lakh more cash than at March, while creditor dues increased by Rs 1.83 crore. Net operating cash generation was Rs 24.05 lakh, although a reported Rs 3.07 crore decrease in other liabilities offset much of the cash benefit from receivables, inventory and payables.
The next financial disclosure will be relevant for any explanation of the difference between the Rs 1.83 crore balance-sheet increase in trade payables and the Rs 1.53 crore cash-flow increase. Investors can also watch whether Kenrik Industries provides more detail on the reported fall in other current liabilities from Rs 1.09 crore to Rs 1.98 lakh.