










K.P. Energy Limited cash inflow falls to Rs 66.44 crore
Key highlights
- K.P. Energy reported Rs 66.44 crore of net operating cash inflow for the six months ended September 30, 2026, down from Rs 84.74 crore.
- K.P. Energy’s inventory reduction released Rs 263.56 crore of cash, versus a Rs 99.86 crore cash use a year earlier.
- Trade receivables absorbed Rs 69.55 crore and current and non-current assets absorbed Rs 226.76 crore in the latest half year.
- K.P. Energy’s cash and cash equivalents increased by Rs 5.98 crore to Rs 11.53 crore at September 30, 2026.
powered by IRIS
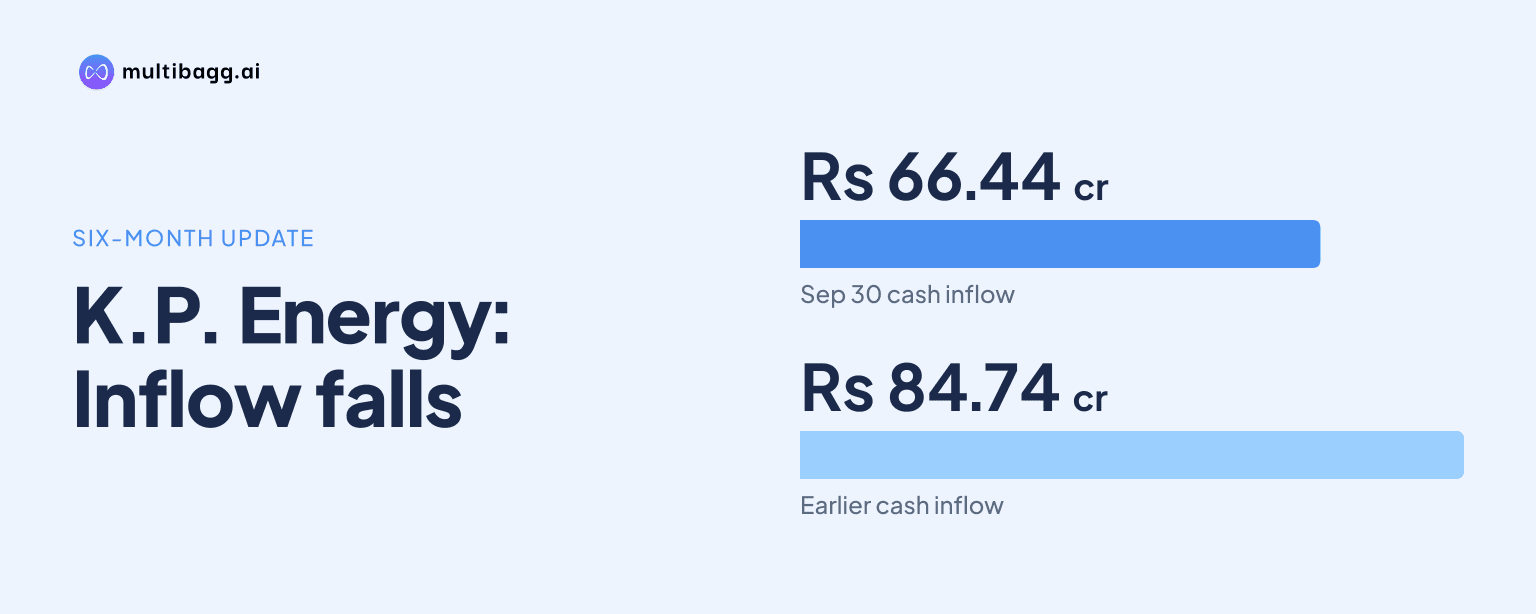
K.P. Energy Limited reported consolidated net operating cash inflow of Rs 66.44 crore for the six months ended September 30, 2026, down from Rs 84.74 crore a year earlier, as a Rs 263.56 crore inventory release was offset by higher receivables and other assets, alongside lower trade payables and provisions.
Know K.P. Energy inside out
Results, valuation, peers and who's buying, in one view.
Why did K.P. Energy’s operating cash inflow fall?
K.P. Energy’s operating cash inflow fell by Rs 18.30 crore year on year because working-capital outflows outweighed the cash released from inventories. Cash generated from operations declined to Rs 77.23 crore from Rs 100.10 crore, while net direct taxes paid were Rs 10.79 crore, compared with Rs 15.36 crore in the corresponding period of 2025. The resulting operating cash flow was Rs 66.44 crore under the indirect method prescribed by Indian Accounting Standard 7, or Ind AS 7.
The decline occurred even though operating profit before working-capital changes increased to Rs 127.24 crore from Rs 122.58 crore. The cash-flow statement starts with profit before tax of Rs 76.01 crore, against Rs 88.48 crore a year earlier, then adjusts for Rs 27.44 crore of interest expense, Rs 18.44 crore of depreciation and amortisation, and Rs 4.55 crore of employee stock-option provision. Interest expense in these adjustments increased from Rs 16.23 crore, while depreciation and amortisation rose from Rs 11.12 crore.
K.P. Energy’s consolidated results reported half-year profit before tax of Rs 76.26 crore, lower than Rs 88.72 crore in the prior-year half. Revenue from operations more than doubled to Rs 1,058.14 crore from Rs 520.16 crore, led by infrastructure-development revenue of Rs 1,031.82 crore. The cash-flow outcome therefore reflected balance-sheet movements as well as reported earnings and revenue during the period.
Which working-capital movements drove K.P. Energy’s cash flow?
K.P. Energy generated Rs 263.56 crore of cash from the decline in inventories, but this was countered by Rs 69.55 crore absorbed by trade receivables, Rs 226.76 crore absorbed by current and non-current assets, and Rs 184.41 crore used through lower trade payables. In the comparable period, inventories had instead used Rs 99.86 crore of cash, while trade receivables had released Rs 114.26 crore. The receivables movement was therefore reversed year on year.
Positive figures in the cash-flow statement denote cash generated, while figures in parentheses denote cash absorption or outflow. The Rs 276.26 crore increase in current and non-current liabilities was the main offset to the reductions in payables and provisions. Current and non-current financial assets had a marginal positive movement in the latest period, compared with a Rs 3.90 crore use of cash a year earlier.
The inventory movement improved by Rs 363.42 crore year on year, changing from a cash use to a cash release. Trade receivables moved in the opposite direction by Rs 183.81 crore, from a Rs 114.26 crore release to a Rs 69.55 crore use. Trade payables remained a cash outflow in both periods, increasing to Rs 184.41 crore from Rs 79.65 crore, while provisions changed from a Rs 33.88 crore source of cash to a Rs 89.13 crore use.
Got a follow-up? Ask IRIS
How did K.P. Energy’s balance-sheet working capital change?
K.P. Energy’s closing inventory declined to Rs 1,069.92 crore on September 30, 2026, from Rs 1,333.48 crore on March 31, 2026, matching the Rs 263.56 crore release reported in cash flow. The inventory reduction was the largest positive movement in the working-capital schedule. It occurred while total current assets increased to Rs 2,196.34 crore from Rs 2,127.42 crore.
Trade receivables increased to Rs 312.72 crore from Rs 244.51 crore over the same period. Other current assets rose to Rs 618.08 crore from Rs 391.32 crore, a Rs 226.76 crore increase corresponding to the cash-flow use in current and non-current assets. Other financial assets were Rs 83.23 crore at September 30, compared with Rs 83.06 crore at March 31, while cash and cash equivalents rose to Rs 11.53 crore from Rs 5.55 crore.
On the liability side, total trade payables fell to Rs 591.91 crore at September 30 from Rs 776.32 crore at March 31. Dues to micro and small enterprises declined to Rs 275.83 crore from Rs 358.02 crore, and dues to other creditors fell to Rs 316.08 crore from Rs 418.30 crore. Current provisions decreased to Rs 35.69 crore from Rs 125.27 crore, while non-current provisions rose to Rs 0.93 crore from Rs 0.48 crore.
How did K.P. Energy’s operating cash compare with other cash flows?
K.P. Energy’s Rs 66.44 crore operating inflow exceeded its Rs 62.93 crore investing outflow, while financing activities provided a further Rs 2.47 crore. Together, these movements produced a Rs 5.98 crore increase in cash and cash equivalents during the six months ended September 30, 2026, compared with a Rs 3.19 crore increase in the prior-year period. Closing cash and cash equivalents were Rs 11.53 crore, versus Rs 5.36 crore at September 30, 2025.
Investing cash outflow narrowed from Rs 104.86 crore to Rs 62.93 crore. Purchases of property, plant and equipment, including capital work in progress, capital advances, capital creditors and right-of-use assets, were Rs 4.56 crore compared with Rs 90.59 crore a year earlier. This was partly offset by a Rs 31.32 crore net outflow for bank deposits, versus Rs 11.04 crore in the prior-year period, while interest received was Rs 2.76 crore against Rs 1.66 crore.
Financing cash inflow fell from Rs 23.30 crore to Rs 2.47 crore. Net proceeds from long-term borrowings were Rs 18.17 crore, compared with a Rs 17.26 crore repayment in the prior period, while net current borrowings added Rs 14.74 crore, down from Rs 66.38 crore. Interest paid rose to Rs 26.31 crore from Rs 16.23 crore, and lease-related interest payments were Rs 3.09 crore, compared with Rs 1.10 crore.
Conclusion
K.P. Energy converted operations into Rs 66.44 crore of cash in the six months ended September 30, 2026, but this was Rs 18.30 crore below the prior-year level. A Rs 263.56 crore inventory reduction provided liquidity, yet receivables, other assets, payables and provisions collectively reduced cash generated from operations to Rs 77.23 crore from Rs 100.10 crore.
The next reported period will clarify whether K.P. Energy can contain the Rs 69.55 crore receivables outflow and the Rs 226.76 crore increase in current and non-current assets while sustaining inventory reductions. Bank-deposit outflows of Rs 31.32 crore and interest payments of Rs 26.31 crore are also unresolved cash-flow items to track against future closing cash balances.