










MGL Q2 revenue rose 24% but profit fell 29% on margin
Key highlights
- MGL’s Q2 FY26-27 net revenue rose 23.80% year on year to Rs 2,537.08 crore.
- MGL’s Q2 FY26-27 PAT fell 29.13% year on year to Rs 137.04 crore.
- MGL’s Q2 FY26-27 EBITDA margin declined to 12.01% from 16.49% a year earlier.
- MGL’s Q2 FY26-27 total gas-sales volume increased to 4.892 MMSCMD from 4.593 MMSCMD.
powered by IRIS
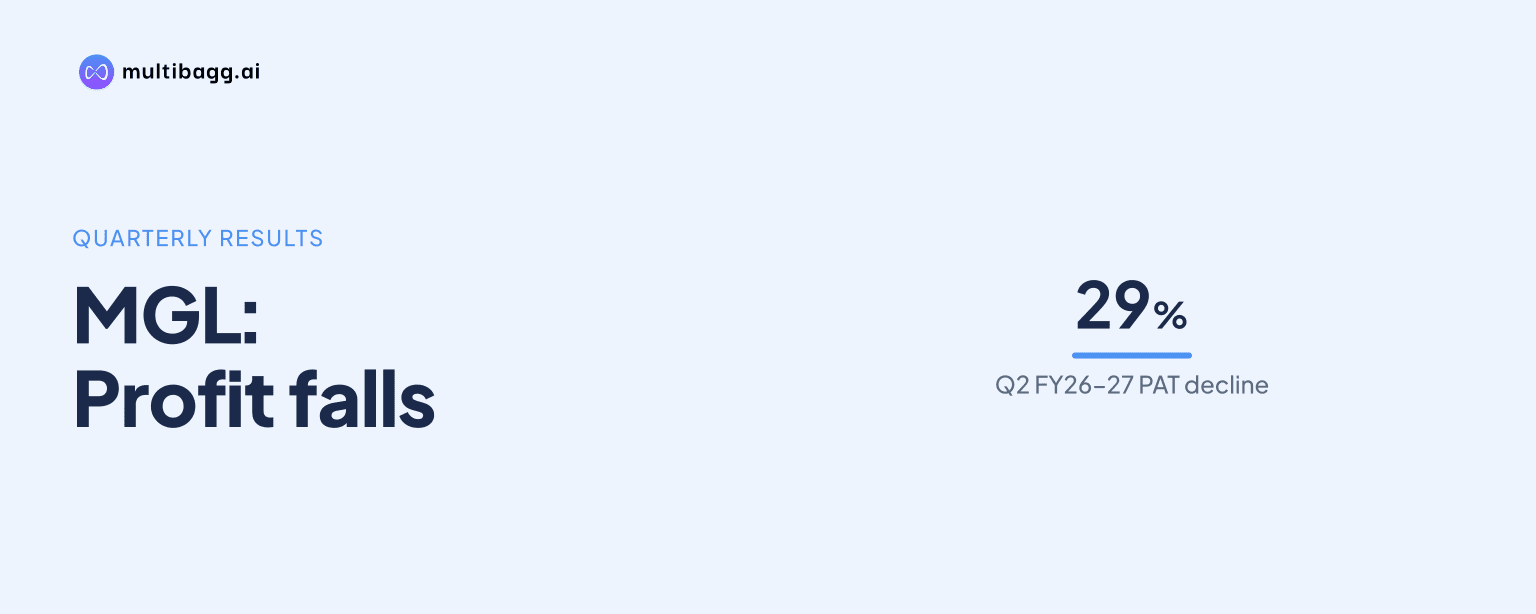
Mahanagar Gas reported Q2 FY26-27 net revenue of Rs 2,537.08 crore, up 23.80% year on year, while profit after tax fell 29.13% to Rs 137.04 crore as EBITDA margin declined to 12.01% from 16.49%. MGL’s gas cost per standard cubic metre rose faster than its net gas-sales revenue per unit.
Know Mahanagar Gas inside out
Results, valuation, peers and who's buying, in one view.
What did MGL report in Q2 FY26-27?
MGL reported higher revenue but lower operating and net profit in Q2 FY26-27. Net revenue increased from Rs 2,049.33 crore in Q2 FY25-26 to Rs 2,537.08 crore, while gross profit was broadly unchanged at Rs 626.79 crore against Rs 624.59 crore. EBITDA, or earnings before interest, tax, depreciation and amortisation, declined 9.82% to Rs 304.76 crore from Rs 337.95 crore. EBITDA margin declined by 4.48 percentage points to 12.01% from 16.49%.
Profit before tax fell 27.49% to Rs 187.08 crore from Rs 258.01 crore, while profit after tax, or PAT, declined to Rs 137.04 crore from Rs 193.36 crore. Basic and diluted earnings per share, which MGL says are not annualised for interim periods, were rupees 13.87 compared with rupees 19.58 a year earlier. The company also reported EBITDA of Rs 342.98 crore and PAT of Rs 193.70 crore in Q1 FY26-27, both above the Q2 figures.
MGL’s profit and loss table displays a negative 6.52% quarter-on-quarter revenue movement, although its stated Q2 revenue of Rs 2,537.08 crore exceeds Q1 revenue of Rs 2,371.71 crore. The presentation’s financial-performance page likewise shows Q2 FY27 revenue of Rs 2,537 crore, compared with Rs 2,372 crore in Q1 FY27. The reported quarter-on-quarter percentage therefore does not match the displayed revenue amounts.
Why did MGL’s margin narrow despite higher revenue?
MGL’s per-unit data show gas costs increased more than net gas-sales revenue in Q2 FY26-27. Net gas-sales revenue rose to rupees 56.11 per standard cubic metre, or SCM, from rupees 48.22 per SCM in Q2 FY25-26, an increase of rupees 7.89. Gas cost rose by rupees 8.69 per SCM to rupees 42.34 from rupees 33.65. The difference reduced gross profit per SCM to rupees 13.77 from rupees 14.57.
The sequential per-unit movement was also lower in Q2 FY26-27. Gross profit per SCM declined from rupees 14.50 in Q1 FY26-27 to rupees 13.77, while EBITDA per SCM fell from rupees 7.91 to rupees 6.77. MGL defines gross profit as gas sales less gas cost, directly linking higher procurement cost per SCM with lower gross profit per unit. In rupee terms, gross profit declined to Rs 626.79 crore from Rs 639.24 crore sequentially.
Got a follow-up? Ask IRIS
Which volumes and segments supported MGL’s revenue growth?
MGL’s total gas-sales volume rose to 4.892 million metric standard cubic metres per day, or MMSCMD, in Q2 FY26-27 from 4.593 MMSCMD in Q2 FY25-26. Compressed natural gas, or CNG, volume increased to 3.552 MMSCMD from 3.255 MMSCMD. Domestic piped natural gas, or DPNG, volume rose to 0.639 MMSCMD from 0.582 MMSCMD, while industrial and commercial volume declined to 0.700 MMSCMD from 0.757 MMSCMD.
CNG accounted for 72.62% of MGL’s Q2 FY27 sales volume and domestic customers represented 13.07%; commercial and industrial customers accounted for 3.27% and 11.04%, respectively. Industrial and commercial volume recovered from 0.648 MMSCMD in Q1 FY27 but remained below the year-earlier 0.757 MMSCMD. Total volume was also above Q1 FY27’s 4.766 MMSCMD, with CNG and DPNG volumes increasing from 3.496 MMSCMD and 0.623 MMSCMD.
MGL states that DPNG has 100% administered price mechanism, or APM, allocation. CNG is supplied partly through APM and new well gas allocation, with the balance coming from market-determined term and spot gas. Industrial and commercial gas is supplied from market-determined term and spot sources, a different procurement mechanism from the priority segments.
What do MGL’s half-year results and balance sheet show?
MGL’s H1 FY26-27 revenue rose 18.84% to Rs 4,908.79 crore from Rs 4,130.71 crore in H1 FY25-26, but EBITDA fell 22.77% to Rs 647.73 crore from Rs 838.66 crore. EBITDA margin declined to 13.20% from 20.30%, and PAT fell 35.52% to Rs 330.73 crore from Rs 512.92 crore. MGL notes that prior-year H1 net revenue includes reversal of an oil marketing company trade margin provided earlier.
At September 30, 2026, MGL’s total assets were Rs 9,514 crore, compared with Rs 8,965 crore at March 31, 2026. Property, plant and equipment increased to Rs 4,953 crore from Rs 4,674 crore, while capital work-in-progress increased to Rs 1,438 crore from Rs 1,259 crore. Trade receivables rose to Rs 570 crore from Rs 458 crore, and total liabilities increased to Rs 2,926 crore from Rs 2,531 crore.
Equity was Rs 6,588 crore at September 30, 2026, compared with Rs 6,434 crore at March 31, 2026. Current liabilities rose to Rs 2,179 crore from Rs 1,955 crore, including trade payables of Rs 571 crore versus Rs 476 crore. Non-current liabilities increased to Rs 747 crore from Rs 576 crore, with lease liabilities rising to Rs 275 crore from Rs 137 crore.
Conclusion
MGL’s Q2 FY26-27 results show that higher sales volumes and higher realised revenue did not translate into higher profit. Total volume rose to 4.892 MMSCMD and revenue increased 23.80%, but the rupees 8.69 year-on-year increase in gas cost per SCM exceeded the rupees 7.89 increase in net gas-sales revenue per SCM. This reduced gross profit per SCM, lowered EBITDA margin by 4.48 percentage points and resulted in a 29.13% fall in PAT.
The next reported period will indicate whether gas cost, which reached rupees 42.34 per SCM in Q2 FY26-27, continues to move relative to revenue per SCM and whether EBITDA per SCM changes from rupees 6.77. MGL’s disclosed sourcing mix remains a key unresolved factor: DPNG has 100% APM allocation, while part of CNG supply and all industrial and commercial supply are sourced at market-determined term and spot prices.