










Nirlon H1 FY27 profit falls 31.4% as tax reversal lapses
Key highlights
- Nirlon’s H1-FY27 profit after tax fell 31.4% to Rs 141.3 crore, while profit before tax rose 3.4% to Rs 189.4 crore.
- H1-FY27 total income increased 3.2% to Rs 346.8 crore, led by a 2.5% rise in license fees to Rs 298.9 crore.
- H1-FY27 EBITDA rose 2.0% to Rs 270.1 crore, although the EBITDA margin declined 95 basis points to 77.88%.
- Nirlon reported 99.8% occupancy in Q2-FY27, with approximately 6,800 square feet vacant across Nirlon Knowledge Park and Nirlon House.
powered by IRIS
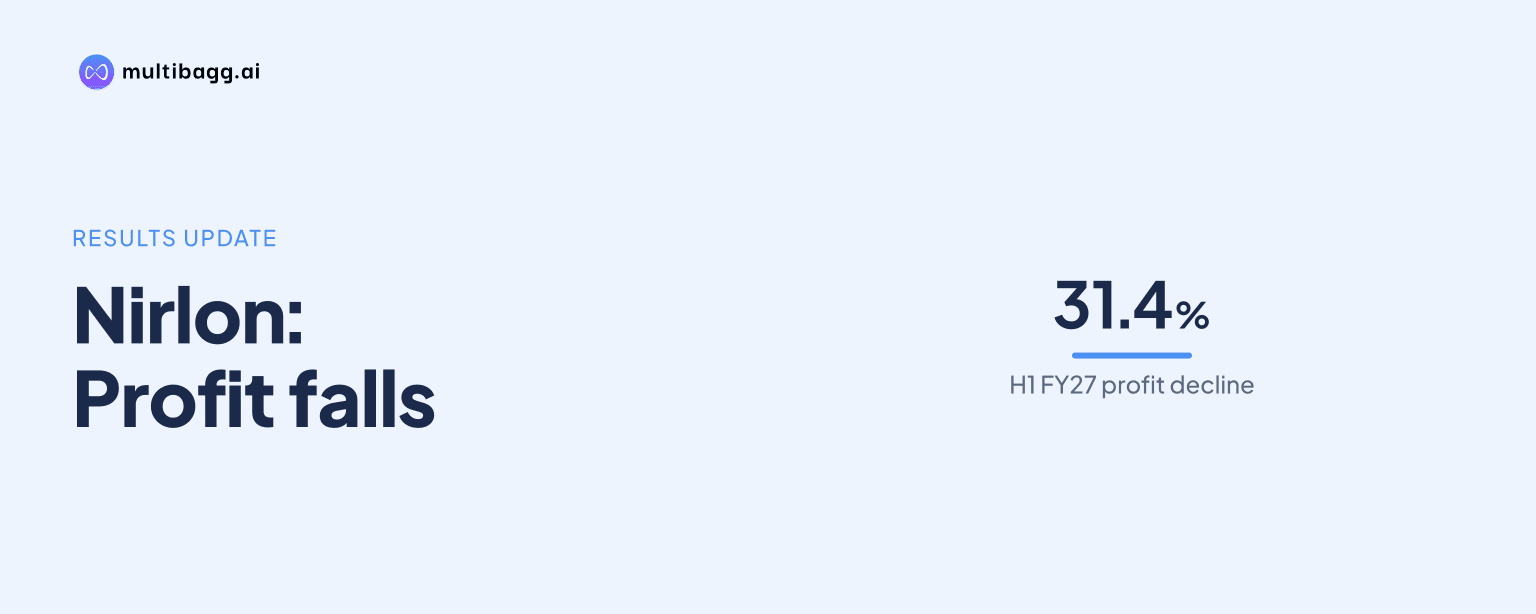
Nirlon Limited reported H1-FY27 profit after tax of Rs 141.3 crore, down 31.4% year on year, although profit before tax rose 3.4% to Rs 189.4 crore. The decline followed the absence of a Rs 69.50 crore deferred-tax liability reversal recorded in Q2-FY26 after Nirlon moved to the new tax regime.
Know Nirlon inside out
Results, valuation, peers and who's buying, in one view.
What caused Nirlon’s H1-FY27 profit decline?
Nirlon’s reported H1-FY27 profit declined because tax changed from a benefit of Rs 22.9 crore in H1-FY26 to an expense of Rs 48.1 crore in H1-FY27. The presentation says Nirlon adopted the new tax regime from Q2-FY26 and remeasured its opening deferred-tax liability, reversing Rs 69.50 crore in Q2-FY26. That reversal was included in the prior-year half-year result and lifted its reported profit after tax.
Profit after tax fell by Rs 64.8 crore to Rs 141.3 crore in H1-FY27 from Rs 206.1 crore a year earlier, even as profit before tax increased by Rs 6.2 crore. Nirlon’s profit-after-tax margin moved to 40.74% from 61.36%, while diluted earnings per share declined 31.4% to Rs 15.68 from Rs 22.87. The movement in earnings per share matched the change in reported profit after tax.
Did Nirlon’s underlying H1-FY27 income grow?
Nirlon’s total income and pre-tax earnings increased in H1-FY27, led by a 2.5% rise in license fees to Rs 298.9 crore. Total income rose 3.2% to Rs 346.8 crore from Rs 335.9 crore, while license fees were Rs 291.6 crore in H1-FY26. Other operating income, including common area maintenance, or CAM, increased 4.9% to Rs 38.5 crore.
Other income rose 23.7% to Rs 9.4 crore from Rs 7.6 crore, while total expenses increased 7.9% to Rs 76.7 crore from Rs 71.1 crore. Earnings before interest, tax, depreciation and amortisation, or EBITDA, therefore increased 2.0% to Rs 270.1 crore, but its margin declined by 95 basis points to 77.88%. One basis point equals one-hundredth of a percentage point.
Nirlon’s lower finance cost supported the rise in profit before tax during the half year. Finance cost fell 2.2% to Rs 52.8 crore from Rs 54 crore, while depreciation rose 1.1% to Rs 27.9 crore. The Rs 5.3 crore increase in EBITDA and lower finance cost contributed to the Rs 6.2 crore increase in profit before tax.
How did Nirlon’s Q2-FY27 performance compare?
Nirlon’s Q2-FY27 profit after tax was Rs 71.9 crore, up 3.6% sequentially from Rs 69.4 crore in Q1-FY27 but down 51.3% from Rs 147.7 crore in Q2-FY26. Q2-FY27 included tax expense of Rs 24.2 crore, while Q2-FY26 recorded a tax benefit of Rs 54.7 crore. The presentation links the prior-year tax outcome to the deferred-tax liability reversal associated with the new tax regime.
Pre-tax measures rose in the quarter. Total income was Rs 174.1 crore, up 0.8% from Rs 172.7 crore in Q1-FY27 and 3.1% from Rs 168.9 crore in Q2-FY26. EBITDA rose 2.2% sequentially to Rs 136.5 crore, and profit before tax increased 3.0% to Rs 96.1 crore.
Nirlon’s Q2-FY27 EBITDA margin was 78.40%, compared with 77.30% in Q1-FY27 and 78.69% in Q2-FY26. License fees reached Rs 149.9 crore, rising 0.6% sequentially and 2.4% year on year. Other operating income was Rs 19.1 crore, while other income rose 45.7% year on year to Rs 5.1 crore and total expenses increased 4.4% to Rs 37.6 crore.
Got a follow-up? Ask IRIS
What operating and lease indicators frame Nirlon’s results?
Nirlon reported 99.8% occupancy at Nirlon Knowledge Park, or NKP, and Nirlon House, or NH, in Q2-FY27, unchanged from Q1-FY27 and above 98.6% in Q2-FY26. As of 30 September 2026, approximately 6,800 square feet was vacant across NKP and NH. The presentation separately identifies about 1,800 square feet vacant at NKP and 5,000 square feet at NH.
The portfolio had 4.77 million square feet of constructed area and 3.08 million square feet of chargeable area across five phases. Phase V was the largest, with 1.78 million square feet constructed and 1.16 million square feet chargeable, compared with 1.29 million and 0.79 million square feet, respectively, in Phase I. This was the operating base for H1-FY27 license fees of Rs 298.9 crore.
Nirlon disclosed 290,000 square feet of licenses due for renewal or reset in FY28, followed by 573,000 square feet in FY29 and 612,000 square feet in FY30. NIUM India Pvt Ltd renewed approximately 37,000 square feet at NKP that had been due to expire in FY28. The renewal schedule assumes licenses continue through their full license tenure or notice period, including renewal options.
Nirlon had Rs 1,150 crore outstanding from HSBC Bank as of 30 September 2026, against a secured facility sanctioned by HSBC of Rs 1,230 crore, including an overdraft facility. Non-current borrowings were Rs 1,089.6 crore at H1-FY27, down from Rs 1,146.7 crore at FY26, while current borrowings rose to Rs 57.6 crore from Rs 0.2 crore. Finance cost declined to Rs 52.8 crore in H1-FY27 from Rs 54 crore a year earlier.
Conclusion
Nirlon’s H1-FY27 figures show a difference between the operating and reported-profit trends. License fees, total income, EBITDA and profit before tax all increased from H1-FY26, whereas profit after tax and earnings per share declined because the prior-year period included a deferred-tax liability reversal of Rs 69.50 crore.
The next disclosed leasing milestones are license renewals or resets covering 290,000 square feet in FY28, 573,000 square feet in FY29 and 612,000 square feet in FY30. Nirlon’s disclosed renewal of about 37,000 square feet by NIUM India Pvt Ltd, 99.8% Q2-FY27 occupancy and 6,800 square feet of vacancy as of 30 September 2026 are the stated operating indicators to watch next.