










Nirlon Limited leverage ratio fell to 1.81 times in FY26
Key highlights
- Nirlon Limited’s net debt-to-EBITDA ratio fell to 1.81 times in FY26 from 2.25 times in FY24, while EBITDA rose to Rs 535.4 crore from Rs 481.4 crore.
- Nirlon’s current borrowings increased to Rs 57.6 crore in H1-FY27 from Rs 20 lakh at FY26-end.
- Nirlon’s non-current borrowings declined to Rs 1,089.6 crore in H1-FY27 from Rs 1,146.7 crore in FY26, leaving total reported borrowings broadly unchanged at about Rs 1,147 crore.
- Nirlon’s H1-FY27 EBITDA rose 2.0% to Rs 270.1 crore, while profit after tax fell 31.4% to Rs 141.3 crore.
powered by IRIS
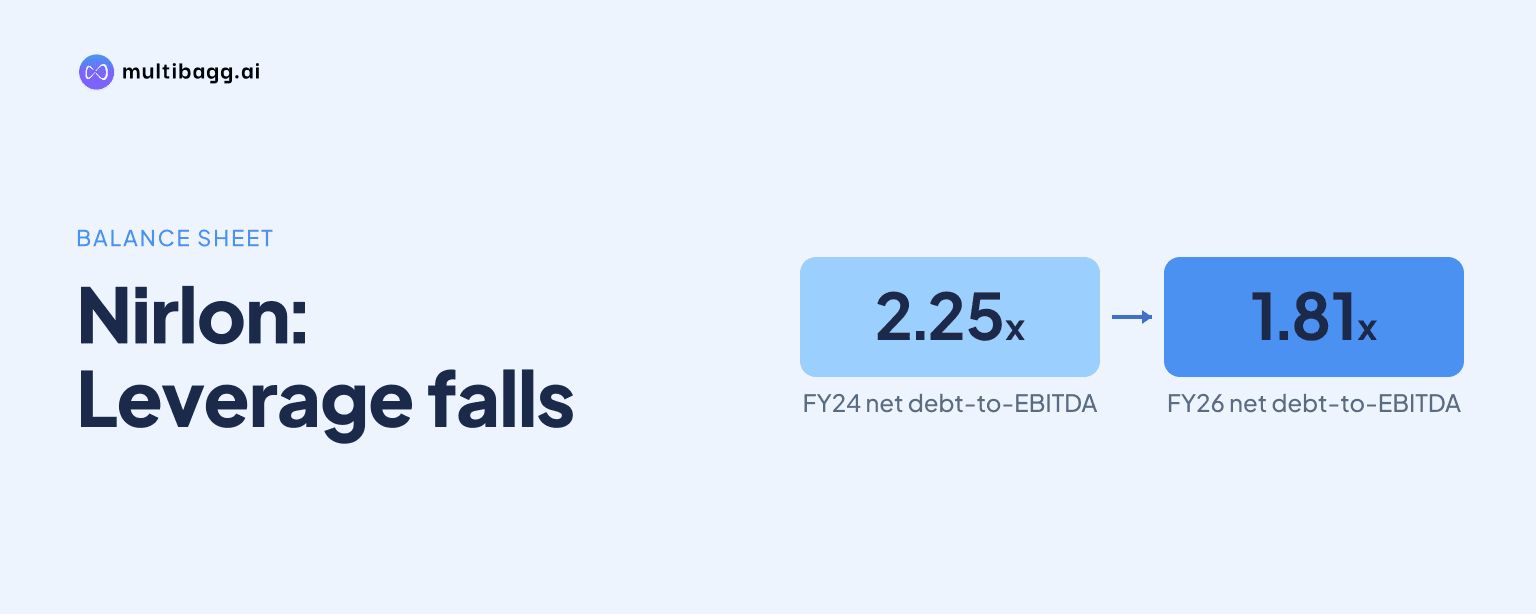
Nirlon Limited reported a net debt-to-EBITDA, or earnings before interest, tax, depreciation and amortisation, ratio of 1.81 times for fiscal year 2026 (FY26), down from 2.25 times in FY24. Its first-half FY27 (H1-FY27) balance sheet then showed Rs 57.6 crore of current borrowings, versus Rs 20 lakh at FY26-end.
Know Nirlon inside out
Results, valuation, peers and who's buying, in one view.
How did Nirlon's leverage change through FY26?
Nirlon's reported net debt-to-EBITDA ratio declined by 0.44 times from 2.25 times in FY24 to 1.81 times in FY26, after recording 1.90 times in FY25. EBITDA rose over the same three fiscal years, from Rs 481.4 crore in FY24 to Rs 511.7 crore in FY25 and Rs 535.4 crore in FY26. The presentation reports the ratio but does not provide its calculation or identify the debt and cash components used for net debt.
The FY26 ratio decline coincided with non-current borrowings that were almost unchanged year on year. Non-current borrowings were Rs 1,146.7 crore in FY26, compared with Rs 1,146.4 crore in FY25, while EBITDA increased by Rs 23.7 crore. This comparison shows that the disclosed leverage measure improved while the reported non-current borrowing line was broadly stable; it does not establish the precise drivers of the net-debt calculation.
Cash and cash equivalents fell to Rs 10 crore at FY26-end from Rs 163.9 crore at FY25-end. Bank balances other than cash and cash equivalents, however, rose to Rs 287.8 crore from Rs 10 crore over the same period. The presentation does not state whether these other bank balances were unrestricted or included in the reported net-debt-to-EBITDA measure.
Why did Nirlon's current borrowings rise in H1-FY27?
Nirlon's current borrowings rose to Rs 57.6 crore in H1-FY27 from Rs 20 lakh in FY26, while the FY25 balance-sheet line was shown as a dash. The presentation does not disclose the lender, interest rate, security, purpose, repayment date or other terms for the H1-FY27 current borrowing, so its funding use cannot be determined from this disclosure.
Total current liabilities increased to Rs 253.2 crore in H1-FY27 from Rs 190.7 crore in FY26, an increase of Rs 62.5 crore. Current borrowings represented most of that movement, while other financial liabilities rose by Rs 13.6 crore to Rs 155.2 crore. Trade payables moved in the opposite direction, declining to Rs 8.3 crore from Rs 16.5 crore, and current tax liabilities fell to Rs 1.4 crore from Rs 2.6 crore.
The rise in current borrowings changed the composition of liabilities during H1-FY27. Other current liabilities increased to Rs 29.9 crore from Rs 28.9 crore, while provisions decreased to Rs 80 lakh from Rs 90 lakh. These balance-sheet movements do not explain whether the Rs 57.6 crore borrowing was newly raised, reclassified from a non-current maturity, or refinanced.
Did Nirlon's non-current borrowings decline in H1-FY27?
Yes. Nirlon's non-current borrowings fell to Rs 1,089.6 crore in H1-FY27 from Rs 1,146.7 crore in FY26, a reduction of Rs 57.1 crore. The decline was close to the Rs 57.6 crore recorded in current borrowings, but the presentation does not explicitly link the two line items.
The sum of current and non-current borrowings was Rs 1,147.2 crore in H1-FY27, compared with Rs 1,146.9 crore in FY26. That leaves the combined reported borrowing lines broadly unchanged across the two periods. This is a comparison of balance-sheet classifications rather than evidence that a specific borrowing was shifted between maturities.
Non-current liabilities declined to Rs 1,533.4 crore in H1-FY27 from Rs 1,590.4 crore in FY26. Other financial liabilities rose to Rs 226.3 crore from Rs 220.6 crore, while deferred tax liabilities increased to Rs 198.4 crore from Rs 194.4 crore. Other non-current liabilities fell to Rs 17.7 crore from Rs 27.3 crore.
Got a follow-up? Ask IRIS
How did Nirlon's liquid assets change in H1-FY27?
Nirlon's current assets increased to Rs 385.6 crore in H1-FY27 from Rs 338 crore at FY26-end. Cash and cash equivalents rose by Rs 21 crore to Rs 31 crore, while bank balances other than cash and cash equivalents increased by Rs 27.6 crore to Rs 315.4 crore.
Together, cash and cash equivalents and other bank balances amounted to Rs 346.4 crore in H1-FY27, compared with Rs 288.8 crore in FY26. Trade receivables were nearly unchanged at Rs 3.4 crore, versus Rs 3.3 crore, and other current assets decreased to Rs 30.4 crore from Rs 31.3 crore. The disclosure does not say how much of the Rs 346.4 crore is available for debt repayment.
On the non-current asset side, investment properties decreased to Rs 1,792 crore in H1-FY27 from Rs 1,831.4 crore in FY26. Capital work in progress increased to Rs 23.3 crore from Rs 7 crore, while total non-current assets declined by Rs 36 crore to Rs 1,875.7 crore. Nirlon does not explain the investment-property reduction or identify the project represented by the capital work in progress.
What did operating earnings show alongside Nirlon's debt figures?
Nirlon's H1-FY27 EBITDA was Rs 270.1 crore, up 2.0% from Rs 264.8 crore in H1-FY26, as total income increased 3.2% to Rs 346.8 crore. License fees rose to Rs 298.9 crore from Rs 291.6 crore, and other operating income, including common area maintenance, increased to Rs 38.5 crore from Rs 36.7 crore.
EBITDA margin decreased by 95 basis points to 77.88% in H1-FY27 from 78.83% in H1-FY26. Total expenses increased 7.9% to Rs 76.7 crore, compared with a 3.2% increase in total income. Finance cost declined 2.2% to Rs 52.8 crore from Rs 54 crore despite the H1-FY27 increase in current borrowings.
Profit before tax rose 3.4% to Rs 189.4 crore in H1-FY27, but profit after tax declined 31.4% to Rs 141.3 crore. Nirlon said the prior-year comparison reflected its move to the new tax regime from Q2-FY26 and a Rs 69.5 crore reversal of opening deferred tax liability in Q2-FY26. That tax item affected the H1-FY26 profit comparison.
Conclusion
Nirlon's FY26 net-debt-to-EBITDA ratio fell from 2.25 times in FY24 to 1.81 times as EBITDA increased from Rs 481.4 crore to Rs 535.4 crore. In H1-FY27, non-current borrowings declined by Rs 57.1 crore, while current borrowings increased to Rs 57.6 crore, leaving combined reported borrowing lines near the FY26 level.
The next balance-sheet disclosure will indicate whether the Rs 57.6 crore current borrowing is repaid, renewed or continues to be classified as current, and whether the reported leverage ratio changes from 1.81 times. Separately, Nirlon's board approved a modification to its dividend distribution policy on November 2, 2026, and said the policy details would be made available on its website.