










NSE funds mobilised rose 41% to ₹13.6 lakh crore in H1FY27
Key highlights
- NSE mobilised ₹13.6 lakh crore in H1FY27, about 41% above ₹9.7 lakh crore in H1FY26.
- Debt fundraising reached ₹10.0 lakh crore in H1FY27, compared with ₹3.7 lakh crore of equity raised.
- Mainboard IPOs rose from 54 to 70 in H1FY27, while SME IPOs fell from 68 to 39.
- NSE reported 3,099 listed entities and ₹468 lakh crore of listed-entity market capitalisation at September 2026.
powered by IRIS
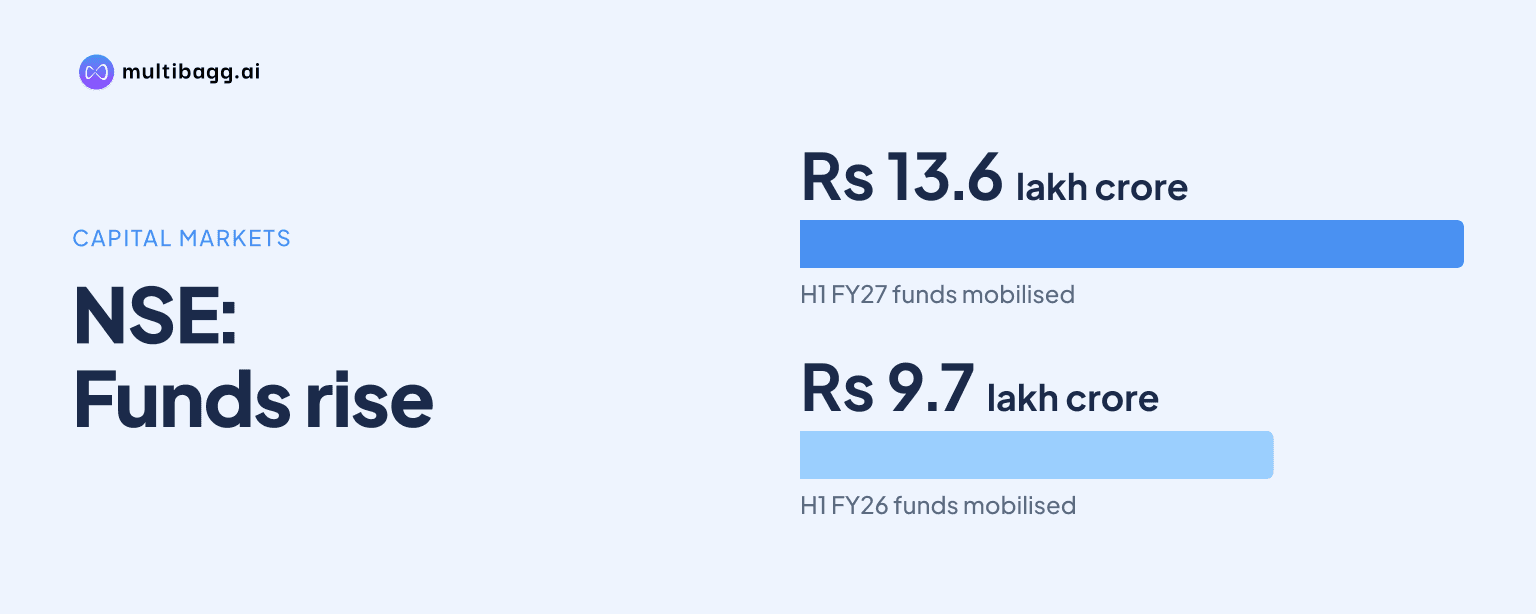
National Stock Exchange of India Limited (NSE) mobilised ₹13.6 lakh crore in H1FY27, about 41% more than ₹9.7 lakh crore in H1FY26, as equity raised rose to ₹3.7 lakh crore and debt raised reached ₹10.0 lakh crore. Initial public offerings (IPOs) shifted towards mainboard issues: mainboard IPOs increased to 70 while small and medium enterprise (SME) IPOs fell to 39.
Know National Stock Exchange Of India inside out
Results, valuation, peers and who's buying, in one view.
How did NSE’s funds mobilised change in H1FY27?
NSE’s total funds mobilised increased by ₹3.9 lakh crore year on year to ₹13.6 lakh crore in H1FY27, compared with ₹9.7 lakh crore in H1FY26. The presentation defines total funds mobilised as the aggregate of funds raised through equity and debt issuances on NSE. Its stated growth rate is about 41%, calculated on absolute figures, while the displayed values are rounded and may have casting differences.
The H1FY27 total was below the ₹20.3 lakh crore mobilised in FY26 but exceeded the ₹18.7 lakh crore reported for all of FY25. Debt remained the larger H1FY27 component at ₹10.0 lakh crore, versus ₹3.7 lakh crore of equity. Compared with H1FY26, debt increased by ₹2.4 lakh crore and equity increased by ₹1.6 lakh crore, meaning both channels contributed to the increase.
What types of fundraising are included in NSE’s figures?
NSE’s ₹3.7 lakh crore equity total for H1FY27 includes IPOs, follow-on public offers, qualified institutional placements, preferential allotments, rights issues and secondary markets. This scope means IPO counts describe only one part of equity fundraising, whereas the equity-raised figure covers several issuance mechanisms on NSE.
NSE’s ₹10.0 lakh crore debt total for H1FY27 includes non-convertible debentures, commercial papers and other debt instruments. In Q2FY27, NSE reported a 62% market share for funds raised through commercial papers. That measure applies specifically to commercial-paper fundraising and is not NSE’s share of all ₹13.6 lakh crore mobilised in H1FY27.
The longer-period data show increases in both funding channels. Equity raised rose from ₹2.4 lakh crore in FY24 to ₹4.8 lakh crore in FY26, while debt raised increased from ₹11.4 lakh crore to ₹15.6 lakh crore. Total mobilisation consequently rose from ₹13.9 lakh crore in FY24 to ₹20.3 lakh crore in FY26 before the ₹13.6 lakh crore recorded in the first half of FY27.
Got a follow-up? Ask IRIS
Why did total IPOs fall even as mainboard IPOs increased?
Total IPOs fell to 109 in H1FY27 from 122 in H1FY26 because the decline in SME IPOs exceeded the increase in mainboard IPOs. Mainboard IPOs rose by 16, from 54 to 70, while SME IPOs declined by 29, from 68 to 39. The overall IPO count therefore decreased by 13 despite a higher number of mainboard offerings.
The H1FY27 mix differed from the prior half-year. Mainboard IPOs accounted for 70 of 109 IPOs, while SMEs accounted for 39, reversing the H1FY26 pattern of 54 mainboard IPOs and 68 SME IPOs. NSE separately reported an 81% market share as the designated stock exchange for mainboard IPOs in Q2FY27 and a 31% share for SME issuances through its NSE Emerge platform.
The shift follows a change across the prior two full years. SME IPOs were 163 in FY25 but fell to 111 in FY26, while mainboard IPOs rose from 79 to 108 in those years. In H1FY27, the 39 SME IPOs were below the 68 recorded in H1FY26, while the 70 mainboard IPOs exceeded both the prior half-year’s 54 and the 75 mainboard IPOs recorded in all of FY24.
How did the number and value of NSE-listed entities change?
NSE reported 3,099 listed entities at September 2026, up from 2,856 at September 2025 and 2,978 at March 2026. The year-on-year increase was 243 entities, while the increase from March 2026 was 121. The presentation states that this measure represents total listed entities on NSE, SME IPOs and mutual funds with funds listed on NSE.
The reported count increased from 2,438 in March 2024 to 2,719 in March 2025, before reaching 2,978 in March 2026. This cumulative measure provides context for the September 2026 total of 3,099, even though IPOs in H1FY27 declined to 109 from 122 a year earlier. A listed-entity count is not equivalent to the number of IPOs in one reporting period.
NSE also reported ₹468 lakh crore of market capitalisation of listed entities at September 2026. The measure covers the aggregate market value of equity shares traded on NSE and units of listed real estate investment trusts and infrastructure investment trusts traded on NSE, measured on the last trading day of the relevant period. It is a valuation of listed securities traded on NSE, rather than a measure of funds mobilised during H1FY27.
Conclusion
NSE’s H1FY27 capital-raising data show ₹13.6 lakh crore of total mobilisation, up about 41% from ₹9.7 lakh crore in H1FY26, with gains in both ₹3.7 lakh crore of equity and ₹10.0 lakh crore of debt. IPO activity moved towards mainboard offerings, where the count reached 70, while the SME count fell to 39 and brought total IPOs down to 109.
The presentation does not disclose a forward mobilisation target, capital-raising plan or scheduled capital-markets event after H1FY27. Subsequent disclosures can be assessed against the reported ₹10.0 lakh crore debt total, ₹3.7 lakh crore equity total and the 70-to-39 mainboard-to-SME IPO mix in H1FY27.