










Nuvama Group Q2 operating PAT rises 26%, cost ratio at 54%
Key highlights
- Nuvama Q2 FY27 operating PAT rose 26% year on year to Rs 319 crore.
- Nuvama Q2 FY27 revenue increased 21% to Rs 937 crore while total costs rose 16% to Rs 507 crore.
- Nuvama’s Q2 FY27 cost-to-income ratio declined to 54% from 57% in Q2 FY26.
- Nuvama Asset Services Q2 FY27 revenue grew 53% year on year to Rs 245 crore.
powered by IRIS
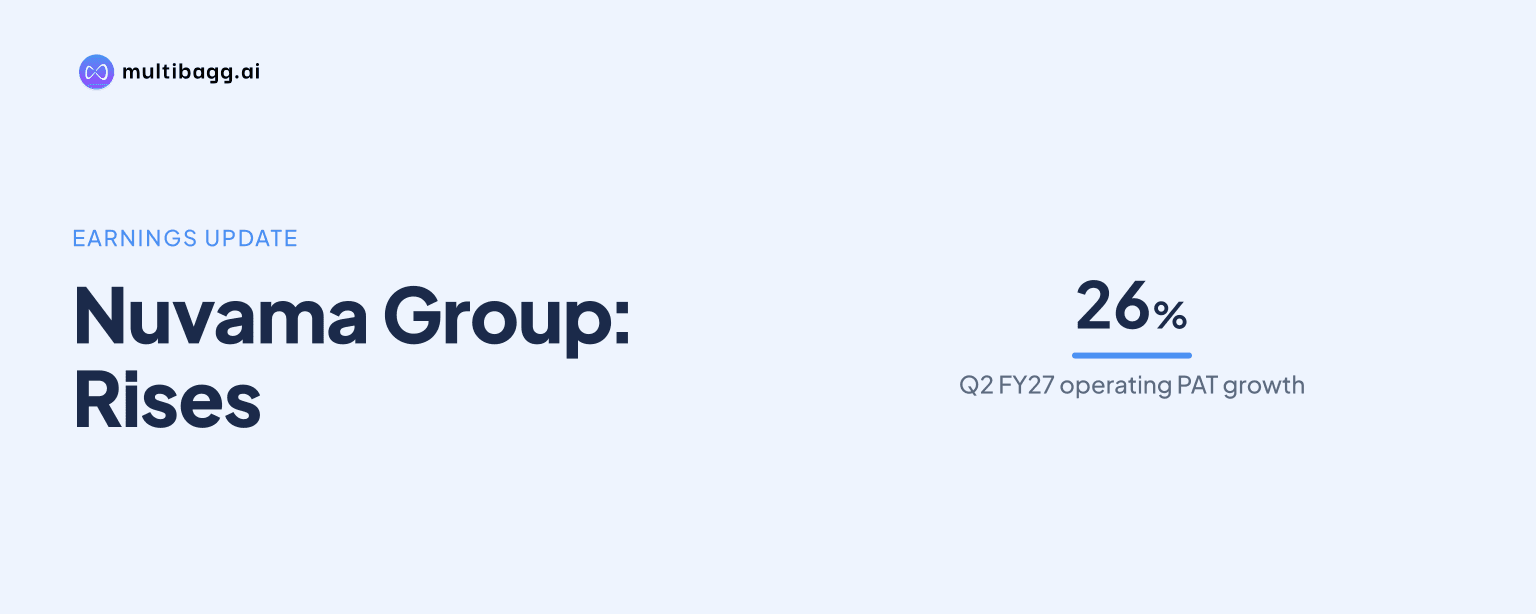
Nuvama Group reported operating profit after tax (PAT) of Rs 319 crore in Q2 FY27, up 26% year on year, as revenue rose 21% to Rs 937 crore and the cost-to-income ratio declined to 54% from 57%. Total costs increased 16%, below revenue growth, while reported PAT was Rs 304 crore after a Rs 16 crore exceptional charge.
Know Nuvama Wealth Management inside out
Results, valuation, peers and who's buying, in one view.
How did Nuvama’s Q2 FY27 operating PAT change?
Nuvama’s operating PAT increased by Rs 65 crore, or 26% year on year, from Rs 254 crore in Q2 FY26 to Rs 319 crore in Q2 FY27. Operating profit before tax (PBT) rose 29%, from Rs 335 crore to Rs 430 crore, according to the consolidated performance table.
Total revenue rose by Rs 165 crore to Rs 937 crore in Q2 FY27 from Rs 772 crore a year earlier. Total costs increased by Rs 70 crore to Rs 507 crore from Rs 437 crore. Revenue therefore grew 5 percentage points faster than costs, while operating PBT growth of 29% exceeded the 21% revenue increase.
Nuvama defines operating PAT as profit after the share of profit from associates and non-controlling interests, but before exceptional items. This distinction affected Q2 FY27 because reported PAT of Rs 304 crore was below operating PAT of Rs 319 crore after a Rs 16 crore exceptional item, net of taxes.
Why did Nuvama’s cost-to-income ratio fall to 54%?
Nuvama’s reported cost-to-income ratio fell to 54% in Q2 FY27 from 57% in Q2 FY26, a decline of 3 percentage points. The ratio also improved from 55% in Q1 FY27, alongside 21% year-on-year revenue growth and 16% growth in total costs.
Employee cost was the largest expense item at Rs 382 crore in Q2 FY27, up 19% from Rs 322 crore in Q2 FY26. Other operating expenditure, or opex, was Rs 125 crore, up 9% from Rs 115 crore. Total costs reached Rs 507 crore as the slower increase in opex partly offset the faster rise in employee cost.
For H1 FY27, the cost-to-income ratio was 55%, compared with 56% in H1 FY26. H1 revenue grew 20% to Rs 1,846 crore while total costs rose 17% to Rs 1,008 crore. Nuvama reports both cost-to-income and return on equity before exceptional items.
Which Nuvama businesses generated Q2 FY27 revenue growth?
Nuvama’s Wealth Management business remained the largest revenue contributor, generating Rs 501 crore in Q2 FY27, or 53% of total revenue, after growing 14% year on year from Rs 438 crore. Its Rs 63 crore increase was the largest absolute rise among the four operating businesses shown in the consolidated table.
Asset Services delivered the fastest reported growth, with Q2 revenue rising 53% to Rs 245 crore from Rs 160 crore a year earlier. Capital Markets revenue increased 9% to Rs 175 crore from Rs 161 crore. Asset Management revenue was Rs 15 crore, compared with Rs 14 crore in Q2 FY26, while Nuvama said management fees were lower 2% year on year.
The business figures total Rs 936 crore in Q2 FY27, compared with consolidated revenue of Rs 937 crore. Nuvama states that total revenue includes a minor amount for corporate items and eliminations. The revenue mix combined growth in the Rs 501 crore Wealth Management business with the 53% expansion in Asset Services.
Got a follow-up? Ask IRIS
How did Nuvama’s first-half FY27 performance compare?
Nuvama’s H1 FY27 operating PAT rose 21% to Rs 625 crore from Rs 518 crore in H1 FY26, an increase of Rs 107 crore. H1 revenue grew 20% to Rs 1,846 crore from Rs 1,542 crore, while operating PBT increased 23% to Rs 838 crore from Rs 684 crore.
The two quarters produced operating PAT of Rs 306 crore in Q1 FY27 and Rs 319 crore in Q2 FY27. Revenue rose sequentially from Rs 909 crore to Rs 937 crore, while total costs increased from Rs 501 crore to Rs 507 crore. The cost-to-income ratio moved down by 1 percentage point from 55% to 54%.
By business, H1 Wealth Management revenue rose 16% to Rs 948 crore, Asset Services revenue rose 43% to Rs 504 crore, and Capital Markets revenue increased 5% to Rs 357 crore. Asset Management revenue increased 11% to Rs 37 crore for H1 FY27, with Nuvama specifying that the stated change for this segment represents management fees.
What affected Nuvama’s reported Q2 FY27 net profit?
Nuvama’s reported Q2 FY27 PAT was Rs 304 crore, up 19% from Rs 254 crore in Q2 FY26 but below operating PAT of Rs 319 crore. The difference reflected a Rs 16 crore exceptional item, net of taxes, from the pre-closure of the Venture Debt Fund in the Asset Management business.
For H1 FY27, reported PAT was Rs 609 crore, compared with operating PAT of Rs 625 crore and reported PAT of Rs 518 crore in H1 FY26. The same Rs 16 crore exceptional charge was recorded in the half year. Reported H1 PAT growth of 18% was consequently lower than the 21% growth in operating PAT.
Nuvama reported return on equity of 28.9% in Q2 FY27, compared with 27.7% in Q2 FY26 and 29.5% in Q1 FY27. H1 FY27 return on equity was 29.2%, compared with 28.9% in H1 FY26. Like the cost-to-income ratio, these return-on-equity figures exclude exceptional items.
Conclusion
Nuvama’s Q2 FY27 results showed operating PAT rising faster than revenue, with PAT up 26% against 21% revenue growth and total costs up 16%. Wealth Management supplied 53% of quarterly revenue, while Asset Services delivered the fastest revenue increase at 53%, and cost-to-income declined to 54% from 57% a year earlier.
What to watch next is whether Nuvama can maintain revenue growth ahead of its cost base as employee cost, which rose 19% in Q2 FY27, remains its largest expense. Management’s disclosed capital-management principles include investing for organic growth, pursuing merger and acquisition opportunities, maintaining a flexible balance sheet and returning capital to shareholders; net worth was Rs 4,553 crore as of September 30, 2026.