










Oval H1 FY27 revenue rose 16% while profit fell 2% year on year
Key highlights
- Oval's H1 FY27 revenue from operations rose 16.01% to Rs 70.72 crore.
- Oval's H1 FY27 EBITDA increased 10.29% to Rs 13.60 crore.
- Oval's H1 FY27 PAT fell 1.71% year on year to Rs 6.25 crore.
- Oval reported FY26 revenue from operations of Rs 153.14 crore and EBITDA margin of 18.44%.
powered by IRIS
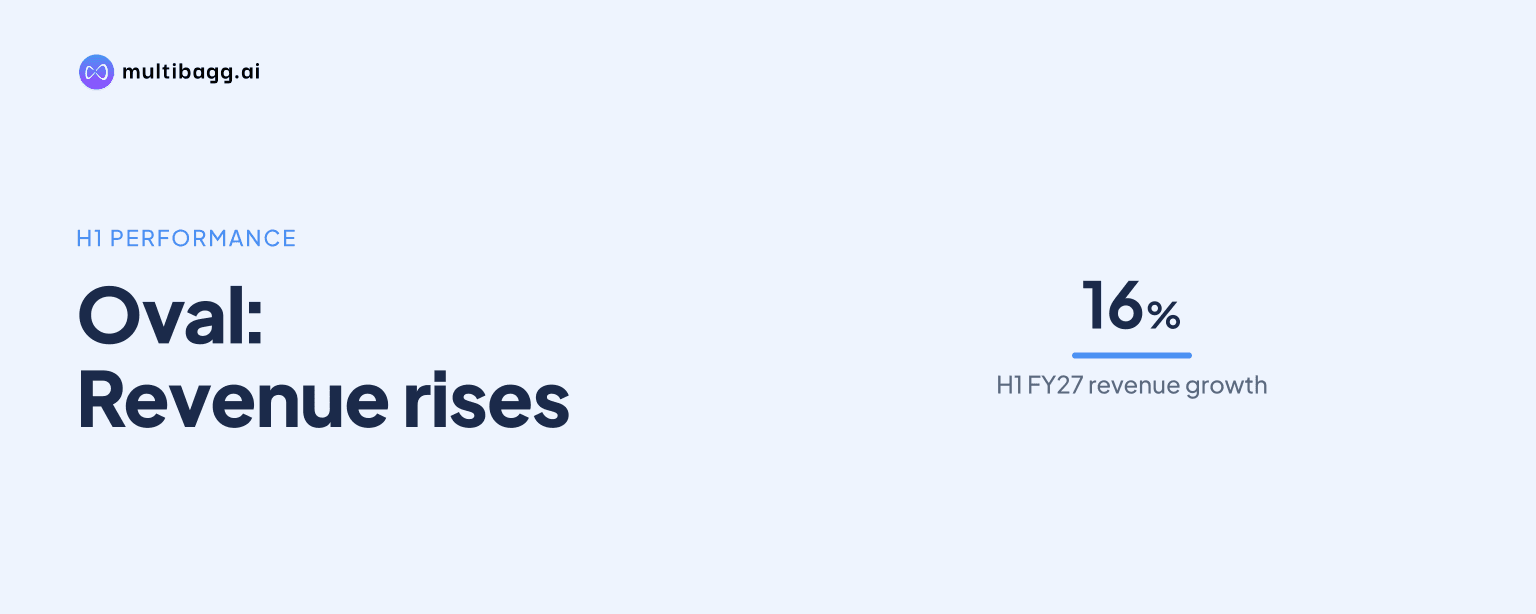
Oval reported standalone H1 FY27 revenue from operations of Rs 70.72 crore, a 16.01% year-on-year increase, but profit after tax fell 1.71% to Rs 6.25 crore. EBITDA rose 10.29% to Rs 13.60 crore, so operating profit grew more slowly than sales during the first half.
Know Oval Projects Engineering inside out
Results, valuation, peers and who's buying, in one view.
What changed in Oval's H1 FY27 income statement?
Oval's H1 FY27 sales increased, EBITDA increased at a slower rate, and profit after tax declined. Revenue from operations rose from Rs 60.96 crore in H1 FY26 to Rs 70.72 crore in H1 FY27, adding Rs 9.76 crore. Total revenue, which includes other income, increased 15.63% to Rs 71.21 crore from Rs 61.58 crore.
The gap between operating growth and sales growth is visible in the reported EBITDA figures. EBITDA, or earnings before interest, tax, depreciation and amortisation, rose by Rs 1.27 crore to Rs 13.60 crore from Rs 12.33 crore. Revenue from operations rose by Rs 9.76 crore over the same H1 FY26 to H1 FY27 comparison.
Profit after tax, or PAT, was Rs 6.25 crore in H1 FY27, down Rs 0.11 crore from Rs 6.36 crore a year earlier. Profit before tax declined by Rs 0.08 crore to Rs 8.84 crore, following the slower 10.29% increase in EBITDA. The reported half-year figures therefore show that the sales increase did not carry through to higher net profit.
Why did Oval's H1 FY27 profit decline?
Oval's presentation shows lower profit before tax and other income alongside slower EBITDA growth, but it does not provide an H1 expense breakdown that identifies one stated cause for the PAT decline. Profit before tax slipped to Rs 8.84 crore from Rs 8.92 crore, while other income fell to Rs 0.49 crore from Rs 0.62 crore over the same periods.
The available figures establish the sequence rather than a specific management explanation. Revenue from operations rose Rs 9.76 crore, whereas EBITDA rose Rs 1.27 crore and profit before tax decreased by Rs 0.08 crore. Any conclusion that attributes the lower PAT to a particular cost line would go beyond the standalone H1 income statement in the presentation.
The annual income statement provides context on the cost categories Oval reports, though it is not a substitute for an H1 comparison. In FY26, raw-material purchases were Rs 80.43 crore, stock-in-trade purchases were Rs 30.97 crore, employee-benefit expense was Rs 5.86 crore and other expenses were Rs 18.46 crore. Finance costs were Rs 6.43 crore and depreciation and amortisation were Rs 1.16 crore in FY26.
That annual format also distinguishes operating earnings from the later stages of profitability. FY26 EBITDA was Rs 28.25 crore, while profit before tax was Rs 21.04 crore and PAT was Rs 14.81 crore. For H1 FY27, readers can observe the movement from Rs 13.60 crore of EBITDA to Rs 8.84 crore of profit before tax and Rs 6.25 crore of PAT, but the presentation does not break down the intervening charges.
Got a follow-up? Ask IRIS
How does H1 FY27 compare with Oval's FY24 to FY26 record?
Oval's H1 FY27 profit movement contrasts with its reported three-year annual growth through FY26. Revenue from operations increased from Rs 77.97 crore in FY24 to Rs 102.29 crore in FY25 and Rs 153.14 crore in FY26. The presentation states a FY24-FY26 revenue compound annual growth rate, or CAGR, of 25.23%.
Annual operating profit expanded faster than revenue over that period. EBITDA rose from Rs 10.86 crore in FY24 to Rs 18.31 crore in FY25 and Rs 28.25 crore in FY26, representing the stated 37.53% CAGR. The reported EBITDA margin increased to 18.44% in FY26 from 17.90% in FY25 and 13.74% in FY24.
PAT increased from Rs 4.37 crore in FY24 to Rs 14.81 crore in FY26, with a stated CAGR of 50.21%. Annual PAT margin rose from 5.53% in FY24 to 9.12% in FY25 and 9.67% in FY26. H1 FY27's 1.71% year-on-year PAT decline therefore interrupts, at least for this half-year comparison, the annual expansion shown through FY26.
What balance-sheet and working-capital factors should readers track?
Oval says roughly 60% of annual turnover is generated during February and March, which results in a higher receivables balance at year-end. Management says receivable days remain within normal levels and working-capital needs are in line with industry standards. This timing pattern matters when comparing an H1 revenue figure of Rs 70.72 crore with full-year revenue of Rs 153.14 crore in FY26.
The standalone balance sheet showed trade receivables of Rs 49.71 crore at H1 FY27, compared with Rs 35.07 crore at FY26 and Rs 43.07 crore at FY25. Inventory was Rs 57.79 crore at H1 FY27, versus Rs 59.07 crore at FY26, while short-term borrowings increased to Rs 47.54 crore from Rs 41.95 crore. Cash and bank balances were Rs 29.51 crore at H1 FY27.
The presentation's roadmap identifies execution of an existing Rs 780 crore order book as part of its FY25-FY26 consolidation phase. It also says Oval plans to expand letter-of-credit and bank-guarantee limits to bid independently for projects valued at Rs 100 crore to Rs 250 crore. The presentation does not state the H1 FY27 order-book balance or provide a project-level revenue conversion schedule.
For FY26-FY28, management's national-expansion phase carries a revenue target of Rs 350 crore to more than Rs 500 crore and an EBITDA-margin target of 19% to 22%. The plan includes western-India expansion in Gujarat petrochemicals and HPCL and BPCL infrastructure services, plus upgrades to project-management-office systems, enterprise-resource-planning systems and procurement technology.
Conclusion
Oval's H1 FY27 result shows revenue growth of 16.01% to Rs 70.72 crore, but EBITDA growth of 10.29% to Rs 13.60 crore and PAT declining 1.71% to Rs 6.25 crore. This differs from FY24 to FY26, when annual revenue increased from Rs 77.97 crore to Rs 153.14 crore and annual PAT increased from Rs 4.37 crore to Rs 14.81 crore.
The next disclosed benchmark is management's FY26-FY28 plan for Rs 350 crore to more than Rs 500 crore of revenue and a 19% to 22% EBITDA margin, followed by a FY28-FY30 revenue target of Rs 900 crore to more than Rs 1,000 crore. Readers will need future disclosures to assess how the Rs 780 crore order book, larger project bidding capacity and the stated margin target translate into revenue, operating earnings and PAT.