










PRAVEG's Q2 EBITDA turns negative as costs outpace sales
Key highlights
- PRAVEG reported a Rs 2.94 crore consolidated EBITDA loss in Q2 FY27, compared with EBITDA of Rs 3.96 crore in Q2 FY26.
- Q2 FY27 net sales rose Rs 6.25 crore to Rs 43.75 crore, while total expenditure increased Rs 13.30 crore to Rs 47.19 crore.
- H1 FY27 consolidated reported net loss widened to Rs 33.37 crore from Rs 14.97 crore in H1 FY26.
- Consolidated cash and bank balance fell to Rs 16.62 crore at H1 FY27 from Rs 38.38 crore at FY26.
powered by IRIS
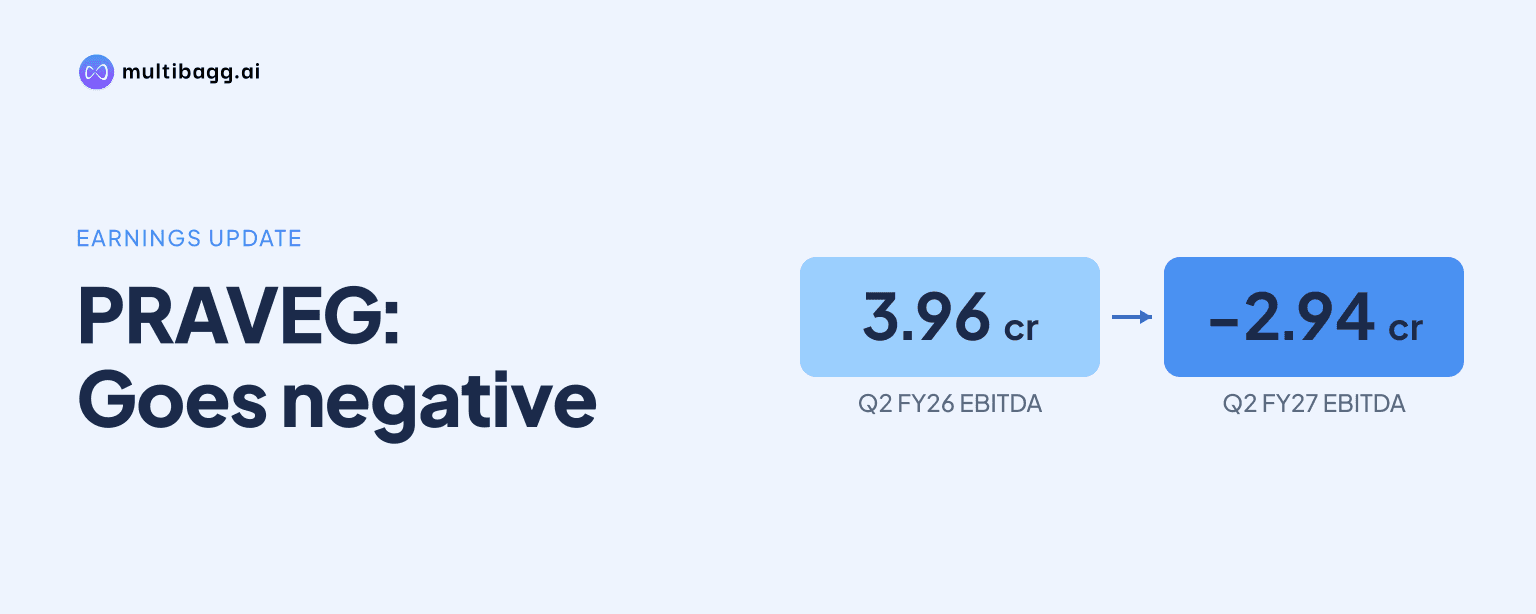
In Q2 FY27, PRAVEG recorded a consolidated earnings before interest, tax, depreciation and amortisation (EBITDA) loss of Rs 2.94 crore, against EBITDA of Rs 3.96 crore in Q2 FY26, as net sales increased Rs 6.25 crore but total expenditure rose Rs 13.30 crore to Rs 47.19 crore.
Know Praveg inside out
Results, valuation, peers and who's buying, in one view.
Why did PRAVEG report an EBITDA loss in Q2 FY27?
PRAVEG reported an EBITDA loss because Q2 FY27 total expenditure of Rs 47.19 crore exceeded total income of Rs 44.25 crore. Consolidated net sales rose to Rs 43.75 crore from Rs 37.50 crore in Q2 FY26, while other income was Rs 0.51 crore compared with Rs 0.34 crore. The EBITDA margin consequently changed to negative 6.63% from a positive 10.45% a year earlier.
Event and site expenses accounted for the largest increase in the operating cost base. These expenses rose Rs 11.50 crore year on year to Rs 30.05 crore, exceeding the Rs 6.25 crore increase in net sales. Employee benefit expenses increased Rs 2.47 crore to Rs 10.21 crore, while other expenses declined Rs 0.67 crore to Rs 6.93 crore.
How did PRAVEG's H1 FY27 earnings compare with last year?
PRAVEG's H1 FY27 EBITDA fell to Rs 0.97 crore from Rs 10.17 crore in H1 FY26, despite net sales rising Rs 12.86 crore to Rs 89.75 crore. Total income increased to Rs 90.46 crore from Rs 77.71 crore, but total expenditure increased Rs 21.97 crore to Rs 89.50 crore. EBITDA margin was 1.07%, compared with 13.09% in the prior-year half.
Event and site expenses rose to Rs 57.09 crore in H1 FY27 from Rs 40.85 crore in H1 FY26. Employee benefit expenses increased to Rs 19.67 crore from Rs 15.15 crore, and other expenses rose to Rs 12.74 crore from Rs 11.53 crore. For comparison, FY26 EBITDA was Rs 59.05 crore on net sales of Rs 240.94 crore, with an EBITDA margin of 24.36%.
PRAVEG reported a loss before tax of Rs 33.58 crore for H1 FY27, compared with a Rs 14.35 crore loss in H1 FY26. Interest expense increased to Rs 8.32 crore from Rs 4.91 crore and depreciation rose to Rs 26.22 crore from Rs 19.61 crore. Reported net loss widened to Rs 33.37 crore from Rs 14.97 crore, while basic earnings per share moved to negative Rs 12.76 from negative Rs 5.73.
Got a follow-up? Ask IRIS
How did PRAVEG's consolidated balance sheet change in H1 FY27?
PRAVEG's consolidated net worth declined to Rs 413.70 crore at H1 FY27 from Rs 449.15 crore at FY26. Equity was unchanged at Rs 26.14 crore, while reserves fell to Rs 387.56 crore from Rs 423.01 crore. Total assets declined Rs 29.55 crore to Rs 685.95 crore, equal to total equity and liabilities at H1 FY27.
Cash and bank balance fell Rs 21.76 crore to Rs 16.62 crore at H1 FY27 from Rs 38.38 crore at FY26. Current assets declined to Rs 144.17 crore from Rs 170.03 crore, whereas current liabilities increased to Rs 124.40 crore from Rs 121.76 crore. Trade receivables were Rs 76.91 crore compared with Rs 77.21 crore, and other current assets fell to Rs 30.67 crore from Rs 38.39 crore.
Non-current liabilities increased to Rs 129.84 crore at H1 FY27 from Rs 127.44 crore at FY26. Non-current lease liabilities rose to Rs 102.40 crore from Rs 98.32 crore, while non-current borrowings declined to Rs 16.97 crore from Rs 17.86 crore. Current borrowings fell to Rs 34.26 crore from Rs 40.94 crore, but short-term provisions increased to Rs 34.76 crore from Rs 25.86 crore.
What do PRAVEG's reported key ratios show?
PRAVEG's reported current ratio declined to 1 time at H1 FY27 from 1.40 times at FY26 and 2.19 times at FY25. The presentation shows current assets of Rs 144.17 crore and current liabilities of Rs 124.40 crore at H1 FY27. It does not provide H1 FY27 return on equity or return on capital employed figures, while FY26 return on equity was negative 2.19% and return on capital employed was 1.69%.
The key-ratio table reports consolidated EBITDA margin of 34.00% in FY24, 32.61% in FY25, 24.36% in FY26 and 1.06% in H1 FY27. Net profit margin moved from 13.75% in FY24 and 9.20% in FY25 to negative 4.06% in FY26 and negative 19.26% in H1 FY27. The H1 FY27 EBITDA margin in that table is 1.06%, while the consolidated profit-and-loss table reports 1.07%.
Debt to equity was 0.12 times at H1 FY27, compared with 0.13 times at FY26 and 0.02 times at FY25. Consolidated earnings per share changed from Rs 5.96 in FY25 to negative Rs 3.81 in FY26 and negative Rs 12.76 in H1 FY27. These movements were reported alongside the H1 FY27 net loss of Rs 33.37 crore and reserves of Rs 387.56 crore.
Conclusion
PRAVEG's Q2 FY27 sales increase did not cover the larger rise in event and site costs and employee expenses. Net sales reached Rs 43.75 crore, but total expenditure of Rs 47.19 crore produced an EBITDA loss of Rs 2.94 crore; interest and depreciation then contributed to a reported net loss of Rs 20.13 crore. In H1 FY27, EBITDA was Rs 0.97 crore and reported net loss was Rs 33.37 crore.
The key unresolved matter is whether PRAVEG can bring event and site expenses, which were Rs 57.09 crore in H1 FY27, closer to the pace of sales growth. The presentation discloses no earnings target or operating-cost plan. Cash and bank balance of Rs 16.62 crore, the current ratio of 1 time, and lease liabilities of Rs 102.40 crore non-current and Rs 15.33 crore current are the reported measures to monitor in later disclosures.