










RattanIndia Enterprises Reports ₹1,974 Crore Q2 FY27 Revenue
Key highlights
- RattanIndia Enterprises reported ₹1,974 crore revenue for Q2 FY27, versus ₹1,806 crore in Q1 FY27 in its investor presentation.
- H1 FY27 consolidated total income was ₹3,935 crore, with EBITDA of ₹52 crore and PAT of ₹84 crore.
- Q2 FY27 orders rose to 3.5 crore from 3.3 crore in Q1 FY27, while the daily sales run rate increased to ₹21.5 crore.
- Cocoblu Retail reported H1 FY27 total income of ₹3,786 crore, compared with ₹3,743 crore in H1 FY26.
powered by IRIS
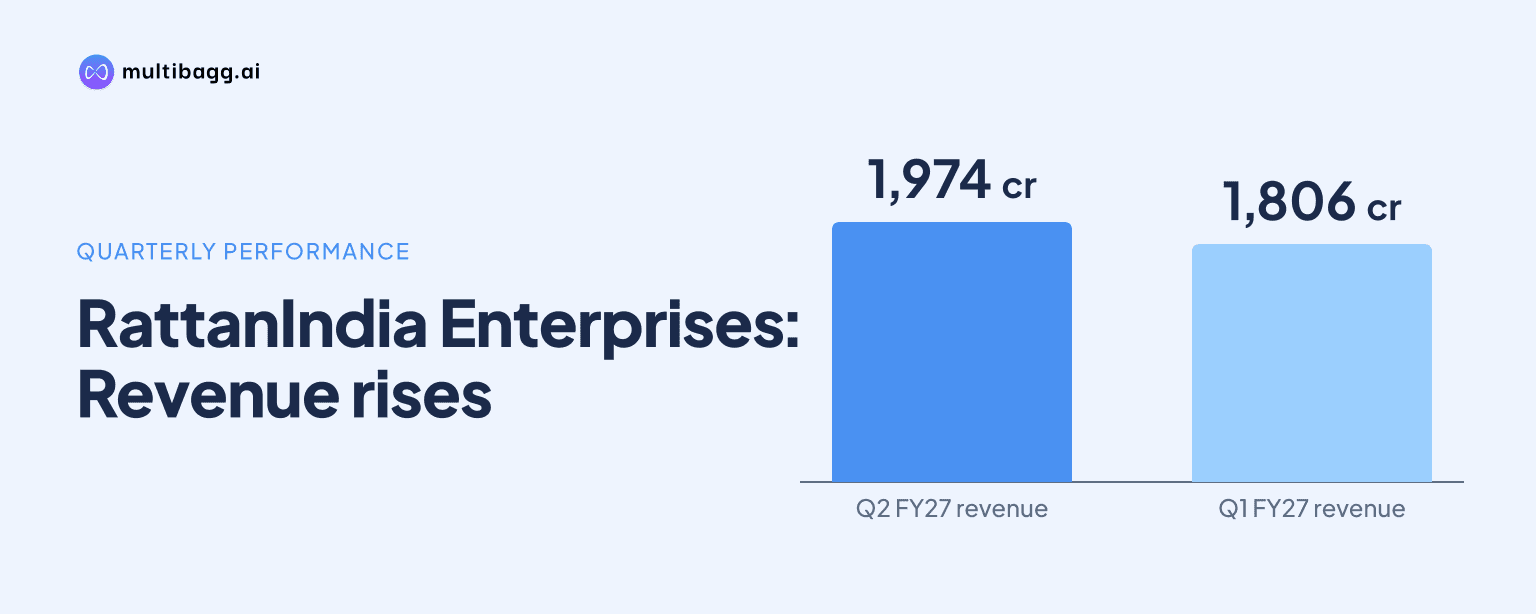
RattanIndia Enterprises Limited reported ₹1,974 crore in revenue for Q2 FY27, compared with ₹1,806 crore in Q1 FY27 in its investor presentation, while H1 FY27 consolidated total income was ₹3,935 crore and consolidated PAT was ₹84 crore. The figures indicate sequential growth in the reported quarterly revenue and operating activity metrics.
Know RattanIndia Enterprises inside out
Results, valuation, peers and who's buying, in one view.
What did RattanIndia Enterprises report for Q2 FY27?
RattanIndia Enterprises reported Q2 FY27 revenue of ₹1,974 crore, up from ₹1,806 crore reported for Q1 FY27 in the investor presentation. The presentation also reported an increase in order volumes and average daily sales run rate during the September quarter.
For the first half of FY27, RattanIndia Enterprises reported consolidated total income of ₹3,935 crore, EBITDA of ₹52 crore and consolidated profit after tax of ₹84 crore. The company has not published an earnings-call transcript for the quarter. Therefore, the reported data reflects the investor presentation and should not be treated as management guidance.
How did operating activity change during the quarter?
Operating activity increased sequentially, with orders rising to 3.5 crore in Q2 FY27 from 3.3 crore in Q1 FY27. The average daily sales run rate also rose to ₹21.5 crore from ₹19.6 crore over the same period.
The presentation stated that lifetime orders served had reached 51 crore. These measures are relevant because they show the scale of customer transactions supporting the group’s reported retail activity. Cocoblu Retail, a business referred to in the presentation, reported H1 FY27 total income of ₹3,786 crore, compared with ₹3,743 crore in H1 FY26. That represents modest year-on-year growth in reported income for the half year.
The higher quarterly order count and daily sales run rate were accompanied by an increase in the presentation’s reported revenue figure. However, the presentation does not provide a detailed quarterly cost breakdown in the information available here. It also does not specify a capex amount, capex programme, or project-level investment target for Q2 FY27.
How should investors read the H1 FY27 profit figures?
The H1 FY27 figures show ₹52 crore of EBITDA and ₹84 crore of consolidated PAT on ₹3,935 crore of consolidated total income. The difference between EBITDA and PAT cannot be assessed fully from these headline presentation figures alone, as the supplied material does not provide a complete bridge for depreciation, finance costs, exceptional items, taxes, or other non-operating components.
The company’s recent reported financial history shows why the distinction between quarterly operations and reported profit is important. For the June 2026 quarter, RattanIndia Enterprises had reported consolidated net profit of ₹15.10 crore, compared with ₹502.72 crore in the June 2025 quarter, while sales were ₹1,870.48 crore. A separate summary of Q1 FY27 similarly cited revenue from operations of ₹1,870.476 crore and net profit of ₹14.735 crore.
These figures do not exactly match the ₹1,806 crore Q1 revenue figure cited in the Q2 investor presentation. The available material does not explain the difference, which may reflect the use of different financial line items or presentation bases. Investors should compare audited or limited-review financial statements and accompanying notes when reconciling revenue, total income and profitability measures.
Got a follow-up? Ask IRIS
What was the market and disclosure context for the results?
RattanIndia Enterprises closed its trading window from October 1, 2026, ahead of the unaudited Q2 and H1 FY27 financial results for the period ended September 30, 2026. The company said the window would reopen 48 hours after the declaration of results, in line with applicable securities-trading rules.
At the time of that disclosure, the company had said the board meeting date to approve the results would be communicated separately. The trading-window closure is a standard compliance step intended to restrict dealing by designated persons while unpublished price-sensitive information may be held internally.
The company’s shares closed at ₹23.54 on the BSE on October 30, 2026, down ₹0.68, or 2.81%, for that session. The supplied information does not establish a direct link between that single-day movement and the Q2 presentation. Market participants generally need the full financial results, notes to accounts and management commentary to assess the sustainability of revenue and profitability trends.
What do the reported numbers mean for investors?
The reported numbers show sequential growth in Q2 revenue, orders and average daily sales run rate, while H1 consolidated total income reached ₹3,935 crore. The operating metrics point to higher transaction activity during the quarter, and Cocoblu Retail’s ₹3,786 crore H1 total income accounted for a substantial part of the group-level income reported in the presentation.
At the same time, the H1 EBITDA of ₹52 crore and PAT of ₹84 crore should be reviewed with the full financial statements rather than viewed in isolation. The absence of an earnings-call transcript means there is no published management commentary in the provided material on margins, cost movements, capital expenditure, business mix or forward targets. This leaves limited basis for drawing conclusions beyond the reported figures.
Conclusion
RattanIndia Enterprises reported ₹1,974 crore of Q2 FY27 revenue in its investor presentation, alongside growth in orders to 3.5 crore and an average daily sales run rate of ₹21.5 crore. For H1 FY27, the company reported consolidated total income of ₹3,935 crore, EBITDA of ₹52 crore and PAT of ₹84 crore, indicating that investors should consider both operating growth and the limited profit-detail disclosure.
The next item to watch is the company’s formal unaudited Q2 and H1 FY27 financial results, including the board-approved statements and notes. Those disclosures may clarify the difference between revenue and total-income measures, provide a fuller view of costs and margins, and state whether any capex plans or additional management commentary are available.