










SBI Life Insurance Company Reports 17% H1 PAT Growth
Key highlights
- SBI Life reported H1 FY27 profit after tax of ₹12.7 billion, up 17% year on year.
- New business premium increased 10% to ₹202.6 billion in the half year ended September 30, 2026.
- Value of new business rose 19% to ₹32.7 billion and the margin was 27.9%.
- Embedded value increased 15% to ₹873.5 billion as of September 30, 2026.
powered by IRIS
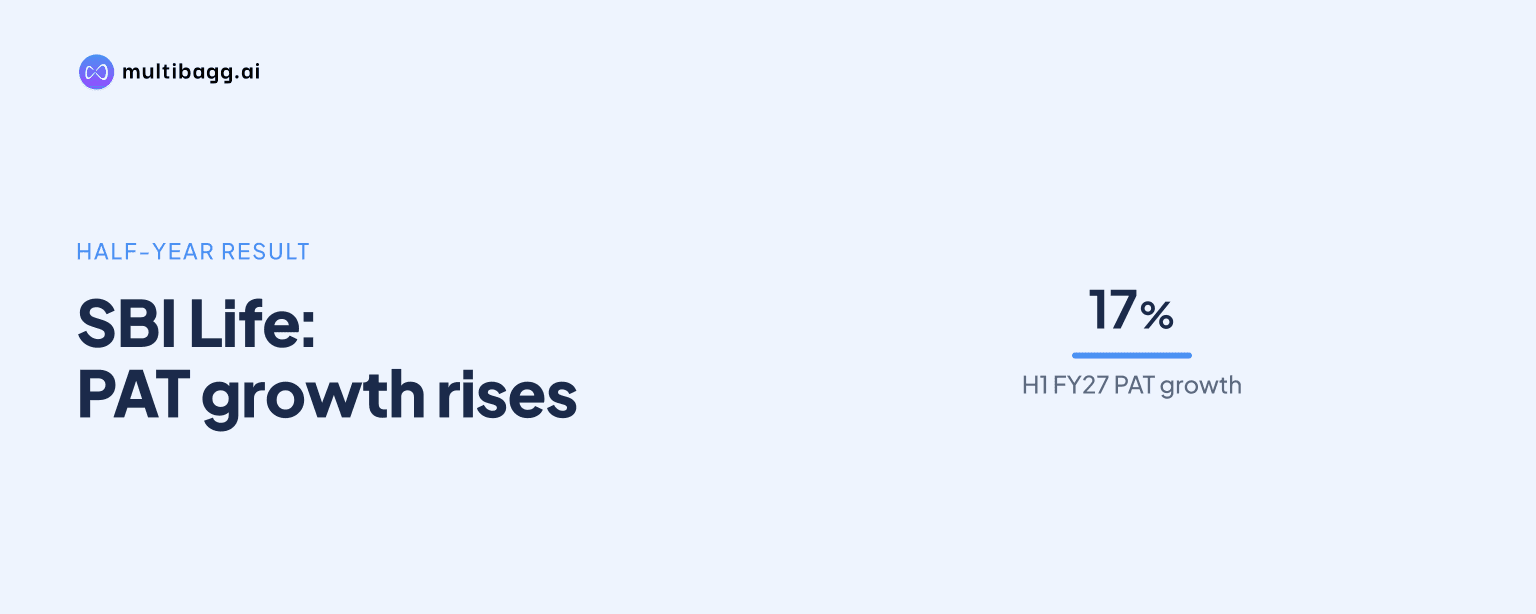
SBI Life Insurance Company reported 17% year-on-year growth in profit after tax to ₹12.7 billion for the half year ended September 30, 2026. New business premium increased 10% to ₹202.6 billion, while value of new business rose 19% to ₹32.7 billion, supporting the insurer's stated growth outlook.
Know SBI Life Insurance Company inside out
Results, valuation, peers and who's buying, in one view.
What did SBI Life report for H1 FY27?
SBI Life reported higher new business premium, value of new business, profit after tax and embedded value for the half year ended September 30, 2026. The insurer said new business premium was ₹202.6 billion, up 10% year on year, while individual rated new business premium grew 12% to ₹97.2 billion. Its private-market share stood at 20%, with the individual rated new business segment accounting for a 22.6% private-market share.
Gross written premium rose 13% to ₹484 billion. Profit after tax increased 17% to ₹12.7 billion, while value of new business, a key profitability measure for new policies sold, grew 19% to ₹32.7 billion. The value of new business margin was 27.9% for the half year and 29.3% for the September quarter, according to management's earnings-call remarks.
How did the October 27 earnings call and disclosure unfold?
SBI Life held its earnings conference call with analysts and investors at 7 pm IST on October 27, 2026, to discuss performance for the quarter and half year ended September 30, 2026. The company had informed stock exchanges about the planned call on October 22 under Regulation 30 of the SEBI Listing Obligations and Disclosure Requirements Regulations.
Managing Director and Chief Executive Officer Amit Jhingran led the call. He was joined by President and Chief Financial Officer Sangramjit Sarangi, President and Chief Risk Officer Subhendu Bal, President and Appointed Actuary Prithesh Chaubey, President Business Strategy Sanjeev Chacko, and Executive Vice President, Finance and Investor Relations Smitha Verma.
The company subsequently announced on October 27 that the audio recording of the call had been hosted on its website. This makes management commentary available to shareholders and other market participants alongside the financial results and stock-exchange disclosures.
What do product mix and distribution trends indicate?
SBI Life said its results reflected distribution performance and a product-mix shift towards non-unit-linked insurance plans and protection products. This mix matters because the profitability of new business depends not only on premium volumes but also on product design, customer persistence, protection benefits and acquisition costs.
The insurer maintained a 27.9% value of new business margin for the half year despite changes in its sales mix. Management said value of new business would have been ₹33.8 billion excluding the goods and services tax impact, representing 19.4% growth, with a margin of 28.8%. For the September quarter, the corresponding margin excluding that impact was stated at 30%.
SBI Life also reiterated guidance for 14-15% growth in IRP for the full financial year, while acknowledging near-term volatility. The guidance places the first-half premium performance in context, as new business premium had increased 10% and individual rated new business premium had increased 12% by September 30.
Got a follow-up? Ask IRIS
Why do embedded value and solvency matter to investors?
SBI Life's embedded value stood at ₹873.5 billion as of September 30, 2026, up 15% from a year earlier. Embedded value combines the adjusted net worth of a life insurer with the present value of profits expected from its existing policy book, making it a widely tracked measure of long-term franchise value in the sector.
Assets under management rose 9% to ₹5.3 trillion. Growth in assets reflects the scale of the insurer's policyholder and shareholder funds, though it can also be affected by market movements and investment flows. The available earnings-call summary also indicated a solvency ratio of about 1.97 times, a regulatory capital measure relevant to an insurer's ability to meet policyholder obligations.
For investors, the 19% growth in value of new business is notable because it exceeded the 10% increase in new business premium. The margin remained close to 28%, indicating that the reported growth was accompanied by a stable level of new-business profitability over the half year.
How could the H1 FY27 results affect SBI Life and the insurance sector?
SBI Life's reported performance provides a view of conditions in India's life-insurance market, where premium growth, distribution reach and product mix influence both sales and profitability. The insurer cited India's economic resilience, household aspirations and evolving customer needs as supportive factors for long-term sector growth.
The results also show the importance of separating quarterly statutory profit from half-year operating metrics. For the September quarter, separately reported net profit was ₹5.49 billion, compared with ₹4.95 billion a year earlier, while revenue was reported at ₹268.78 billion. The half-year figures discussed on the call, including ₹12.7 billion profit after tax and ₹32.7 billion value of new business, cover the six months to September 30.
The audio disclosure does not itself change the financial results, but it gives investors access to management's explanation of premium growth, margins, distribution and guidance. The next assessment will depend on whether premium momentum, mix trends and margins remain consistent with the full-year IRP growth guidance.
Conclusion
SBI Life delivered growth across key half-year measures, with profit after tax rising 17%, value of new business rising 19% and embedded value rising 15%. New business premium growth was lower than value of new business growth, while the 27.9% value of new business margin indicated stable new-business profitability during the period.
Investors will watch the remaining FY27 premium trajectory against management's 14-15% IRP growth guidance, as well as the durability of margins amid changes in product mix and the stated goods and services tax impact. Further quarterly disclosures will provide updated evidence on these operating measures.