










Sindhu Trade Links half-year profit falls as finance costs rise
Key highlights
- Sindhu Trade Links reported half-year standalone net profit of Rs 9.9116 crore, down from Rs 10.6405 crore.
- Sindhu Trade Links’ half-year total income fell 12.4% to Rs 207.5263 crore.
- Sindhu Trade Links’ finance cost rose 31.8% to Rs 23.7944 crore.
- Transportation, Logistics & Construction revenue was Rs 181.4449 crore in the half year ended 30 September 2026.
powered by IRIS
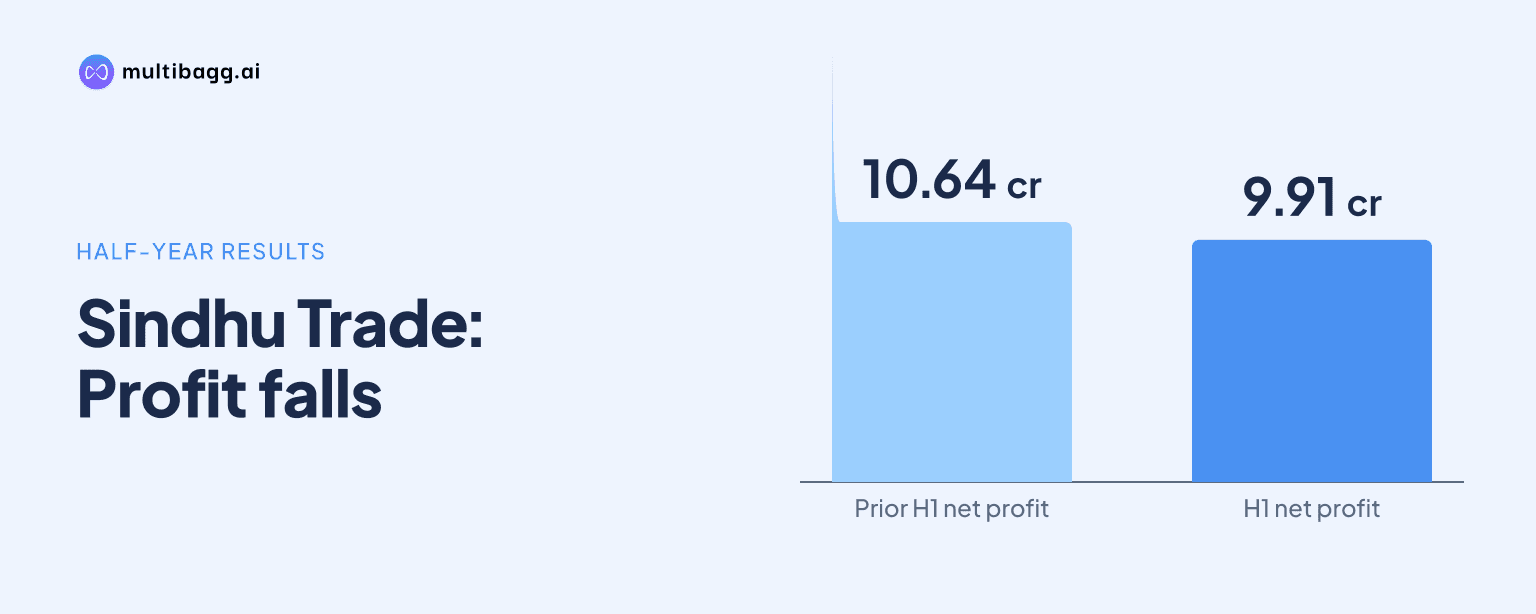
Sindhu Trade Links Limited reported standalone net profit of Rs 9.9116 crore for the half year ended 30 September 2026, down 6.9% from Rs 10.6405 crore a year earlier, as finance costs rose to Rs 23.7944 crore from Rs 18.0487 crore. Total income declined 12.4% to Rs 207.5263 crore.
Know Sindhu Trade Links inside out
Results, valuation, peers and who's buying, in one view.
Why did Sindhu Trade Links’ half-year profit decline?
Sindhu Trade Links’ half-year profit declined because lower income and higher finance costs outweighed an increase in aggregate segment results. Profit before tax fell 21.0% to Rs 12.458 crore in the half year ended 30 September 2026 from Rs 15.8951 crore in the corresponding previous-year period. Net profit after tax was Rs 9.9116 crore, compared with Rs 10.6405 crore a year earlier.
Total income was Rs 207.5263 crore, versus Rs 236.9681 crore in the comparable half year. Revenue from operations decreased 9.8% to Rs 204.4657 crore from Rs 226.7076 crore, while other income fell to Rs 3.0606 crore from Rs 10.2605 crore. Total expenses declined 11.8% to Rs 195.0683 crore, but not enough to prevent the reduction in profit before tax.
The September-quarter result also showed lower earnings. Net profit for the quarter ended 30 September 2026 was Rs 3.6517 crore, compared with Rs 6.3644 crore in the quarter ended 30 September 2025. Quarterly total income declined to Rs 92.8913 crore from Rs 114.2357 crore, while quarterly finance cost increased to Rs 13.1912 crore from Rs 9.1389 crore.
How much did finance costs affect Sindhu Trade Links’ earnings?
Finance cost was Rs 23.7944 crore for the half year ended 30 September 2026, an increase of Rs 5.7457 crore from Rs 18.0487 crore in the prior-year half year. The standalone segment statement classified finance cost as an unallocable expense, reducing profit before tax after total segment results of Rs 36.2511 crore.
Aggregate segment results increased to Rs 36.2511 crore from Rs 33.9438 crore, a gain of Rs 2.3073 crore. Finance cost increased by more than twice that gain, while other income included in segment results declined by Rs 7.1999 crore to Rs 3.0606 crore. These changes coincided with a Rs 3.4371 crore fall in profit before tax.
Non-current borrowings were Rs 500.5791 crore as at 30 September 2026, compared with Rs 378.89 crore at 31 March 2026. Current borrowings increased to Rs 26.9359 crore from Rs 14.6609 crore over the same period. The filing does not state why finance costs increased or disclose the interest rates on those borrowings.
Which Sindhu Trade Links segments changed during the half year?
Transportation, Logistics & Construction remained Sindhu Trade Links’ largest reported revenue segment, although its half-year revenue fell 8.2% to Rs 181.4449 crore from Rs 197.589 crore. Its segment result increased to Rs 30.5034 crore from Rs 26.4529 crore, a rise of Rs 4.0505 crore before unallocable expenses.
Finance Operations revenue increased to Rs 6.1671 crore from Rs 1.9069 crore, while its segment result moved to a profit of Rs 1.274 crore from a loss of Rs 3.6158 crore. Oil, Lubricants & Spares revenue was Rs 16.8537 crore against Rs 16.6875 crore, and its segment result rose to Rs 1.4624 crore from a loss of Rs 0.0304 crore.
Oil Drilling Operations reported no half-year revenue for the period ended 30 September 2026, compared with Rs 10.5242 crore a year earlier. Its segment result was Rs 0.0684 crore, down from Rs 0.8766 crore. Other income also declined to Rs 3.0606 crore from Rs 10.2605 crore, contributing to the reduction in total income.
Got a follow-up? Ask IRIS
What does Sindhu Trade Links’ September balance sheet show?
Sindhu Trade Links reported total assets of Rs 2,526.6436 crore as at 30 September 2026, compared with Rs 1,475.1193 crore at 31 March 2026. Non-current investments were Rs 1,814.5099 crore, compared with Rs 890.6492 crore at the preceding financial year-end, representing the largest stated movement among non-current assets.
Total equity increased to Rs 1,878.4577 crore from Rs 946.0402 crore. It comprised equity share capital of Rs 184.2384 crore and other equity of Rs 1,694.2193 crore at 30 September 2026. Cash and cash equivalents were Rs 157.9978 crore, compared with Rs 1.2817 crore at 31 March 2026.
Net cash flow from operating activities was Rs 22.0551 crore for the six months ended 30 September 2026, while net cash flow from investing activities was Rs 25.7202 crore. Net cash flow from financing activities was Rs 108.9398 crore, including finance cost paid of Rs 23.7934 crore. The comparative cash-flow figures supplied are for the year ended 31 March 2026 rather than a comparable six-month period.
What did the review report say about Sindhu Trade Links’ results?
Sindhu Trade Links’ statutory auditor, N G C & Associates LLP, said nothing had come to its attention indicating that the standalone unaudited results were not prepared in accordance with applicable accounting standards or contained a material misstatement. The report, dated 14 November 2026, was a limited review and not an audit opinion.
The board approved the standalone and consolidated unaudited results for the quarter and half year ended 30 September 2026 on 14 November 2026. Sindhu Trade Links said the limited review report under Regulation 33 of the Securities and Exchange Board of India Listing Obligations and Disclosure Requirements Regulations, 2015 contained no observation that would affect the standalone quarterly results.
Sindhu Trade Links reports four operating segments under Indian Accounting Standard 108: Transportation, Logistics & Construction; Oil, Lubricants & Spares; Finance & Investment; and Oil Drilling Operations. Basic earnings per share for the half year were Rs 0.06, compared with Rs 0.07 in the prior-year half year, while diluted earnings per share were Rs 0.05 compared with Rs 0.07.
Conclusion
Sindhu Trade Links’ standalone half-year outcome combined a 12.4% decline in total income with a 31.8% increase in finance cost, producing a 21.0% reduction in profit before tax and a 6.9% decline in net profit. Transportation, Logistics & Construction remained the main revenue source at Rs 181.4449 crore, while better segment results in Finance Operations and Oil, Lubricants & Spares did not offset lower other income and finance costs.
The key unresolved matters are the drivers of the higher finance cost and the increase in borrowings to Rs 527.515 crore in aggregate at 30 September 2026, from Rs 393.5509 crore at 31 March 2026. The filing does not disclose a financing plan, interest-rate details, management guidance or a profit target, so subsequent disclosures will be needed to assess changes in those balances and expenses.