










Solve Plastic Products reports ₹1.2 crore H1 FY27 net loss
Key highlights
- Solve Plastic Products reported H1 FY27 revenue from operations of ₹25.4 crore, up 16.5% year on year.
- Net profit changed from a ₹0.4 crore profit in H1 FY26 to a ₹1.2 crore loss in H1 FY27.
- Operating margin fell to negative 4.3% in H1 FY27 from positive 3.2% a year earlier.
- FY26 audited total income was ₹46.12 crore and net profit was ₹0.437 crore.
powered by IRIS
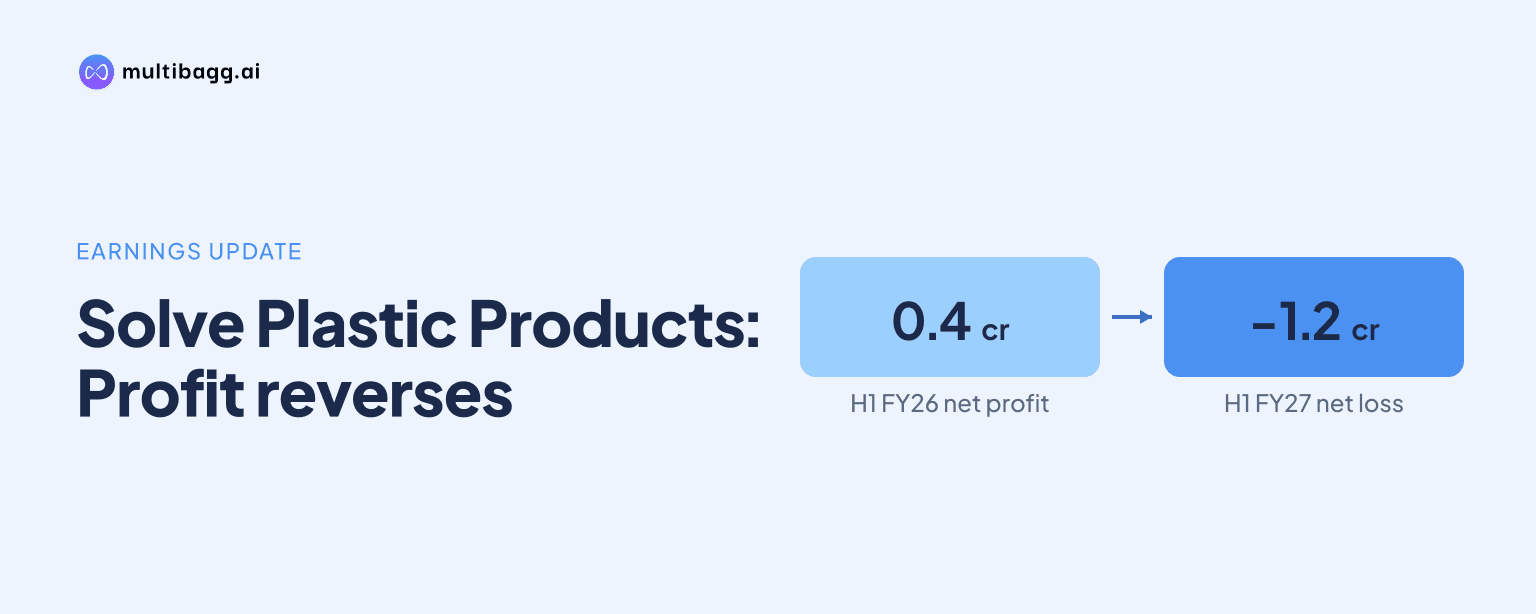
Solve Plastic Products Ltd reported a net loss of ₹1.2 crore in H1 FY27 despite revenue from operations rising 16.5% year on year to ₹25.4 crore. The result marks a shift from a ₹0.4 crore net profit in H1 FY26, with operating margin falling to negative 4.3% from positive 3.2%.
Know Solve Plastic Products inside out
Results, valuation, peers and who's buying, in one view.
What did Solve Plastic Products report for H1 FY27?
Solve Plastic Products Ltd reported total income of ₹25.5 crore for H1 FY27 and a loss before tax of ₹1.1 crore. The company disclosed the standalone financial results on 13 November 2026. Revenue from operations was ₹25.4 crore, while other income was ₹0.1 crore.
The reported net loss of ₹1.2 crore contrasts with net profit of ₹0.4 crore in the corresponding half of the preceding financial year. Profit before exceptional items and tax was also negative at ₹1.1 crore. The disclosed figures do not identify exceptional items, and profit before tax remained at the same negative ₹1.1 crore level.
How did revenue growth compare with profitability?
Solve Plastic Products increased revenue from operations by ₹3.6 crore from ₹21.8 crore in H1 FY26 to ₹25.4 crore in H1 FY27, representing the reported 16.5% year-on-year growth. Total income increased by ₹3.3 crore over the same comparison, from ₹22.2 crore to ₹25.5 crore.
However, the higher revenue did not translate into a positive operating result. Operating margin moved from 3.2% in H1 FY26 to negative 4.3% in H1 FY27, a deterioration of 7.5 percentage points. Other income also declined to ₹0.1 crore from ₹0.4 crore, although the financial disclosure does not provide a detailed explanation for the change in profitability.
Against H2 FY26, revenue from operations was higher by ₹1.6 crore, while total income rose by ₹1.6 crore. But the loss before tax widened from ₹0.1 crore in H2 FY26 to ₹1.1 crore in H1 FY27, and operating margin declined from negative 0.4% to negative 4.3%.
How does the result compare with the previous full year?
Solve Plastic Products had reported audited FY26 total income of ₹46.12 crore and net profit of ₹0.437 crore. The company had returned to profitability in FY26 after recording a loss in FY25, with the FY26 update citing revenue growth as the primary driver of that improvement.
H1 FY27 revenue from operations of ₹25.4 crore is more than half of FY26 total income, but the interim loss shows that sales growth alone has not preserved the prior year's positive earnings outcome. The FY26 audited results carried an unmodified audit opinion, according to the information provided.
The company manufactures unplasticized polyvinyl chloride, or uPVC, pipes and rigid PVC electrical conduits in India. Its financial performance is therefore relevant to investors tracking smaller domestic building-material and plastic-pipe businesses, where revenue growth, margins and working-capital discipline can materially influence reported earnings.
Got a follow-up? Ask IRIS
What does the H1 FY27 result mean for investors and operations?
Solve Plastic Products' H1 FY27 result means investors have a higher revenue base to assess alongside weaker profitability indicators. The company moved from a ₹0.4 crore profit to a ₹1.2 crore loss year on year, while the operating margin turned negative. These reported metrics point to a weaker earnings outcome for the half year despite the 16.5% increase in sales.
No share-price movement, management commentary, customer impact or operational reason for the margin decline was included in the supplied disclosure. As a result, the available data does not establish whether the loss arose from input costs, selling expenses, product mix, financing items or another factor. It also does not provide volume, pricing or order-book data.
For the wider pipe and conduit segment, the result illustrates that revenue expansion does not necessarily lead to profit expansion in a given reporting period. The key disclosed evidence is the divergence between ₹25.4 crore of revenue from operations and the negative 4.3% operating margin, compared with a positive 3.2% margin a year earlier.
Why are margins central to the H1 FY27 assessment?
Margins are central because they show how much of reported income remains after operating costs, rather than measuring sales alone. In H1 FY27, Solve Plastic Products recorded a negative 4.3% operating margin on total income of ₹25.5 crore. In H1 FY26, the company generated a 3.2% operating margin on ₹22.2 crore of total income.
The movement is also relevant because FY26 profitability was limited even after the company returned to the black. FY26 net profit was ₹0.437 crore on total income of ₹46.12 crore, implying that the company entered FY27 with a relatively narrow reported profit base. The H1 FY27 loss places the focus on subsequent disclosures for clarity on cost trends and any measures disclosed by the company.
Conclusion
Solve Plastic Products delivered higher H1 FY27 revenue but reported a ₹1.2 crore net loss, reversing the ₹0.4 crore profit recorded a year earlier. The main financial change was the operating-margin decline to negative 4.3%, which offset the 16.5% growth in revenue from operations.
The next result will be important for assessing whether revenue growth continues and whether operating margin improves from the H1 FY27 level. The supplied disclosure does not set out a profit target, recovery plan or detailed cause of the loss, leaving future company filings as the main source of further clarity.