










Sunflag operating cash flow reaches Rs 338.71 crore in first half
Key highlights
- Sunflag generated Rs 338.71 crore of operating cash in the half year ended September 30, 2026, versus Rs 173.95 crore a year earlier.
- Sunflag's cash and cash equivalents rose to Rs 321.33 crore at September 30, 2026 from Rs 180.41 crore at March 31, 2026.
- Sunflag's total standalone borrowings fell by Rs 81.75 crore to Rs 388.52 crore at September 30, 2026.
- Sunflag spent Rs 90.21 crore on property, plant and equipment, capital work-in-progress and capital advances in the first half.
powered by IRIS
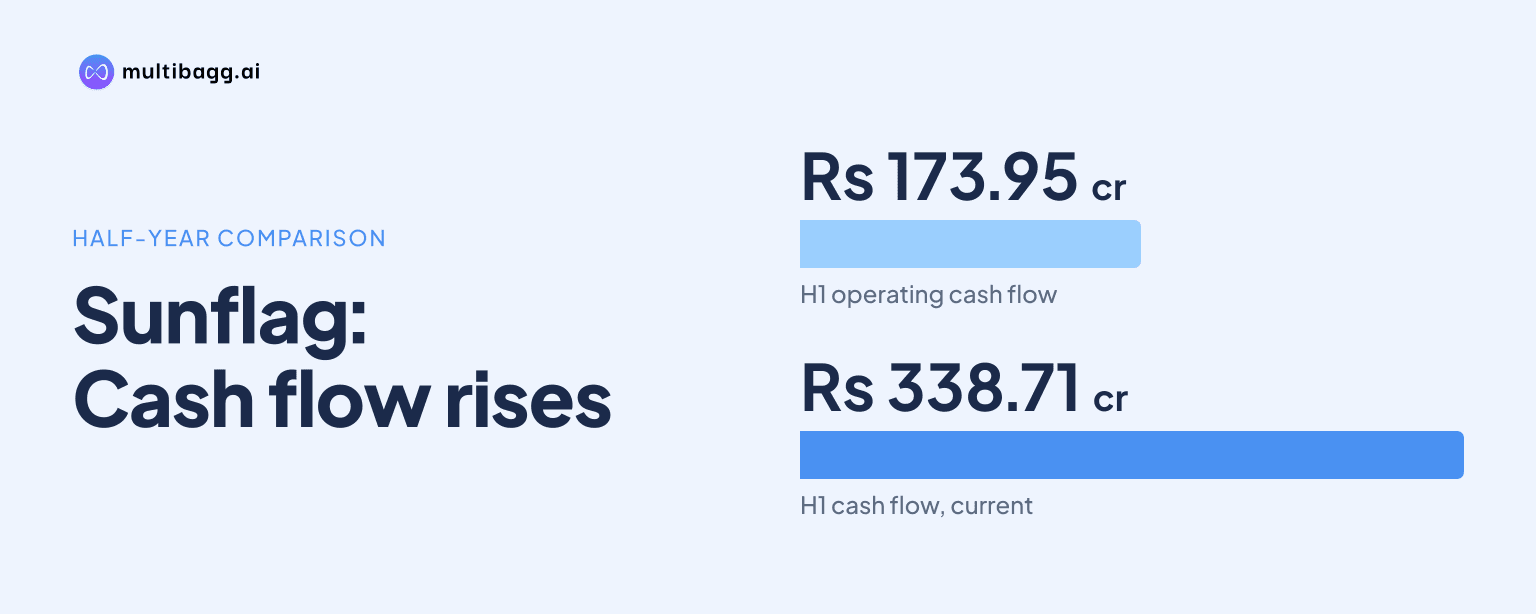
Sunflag Iron and Steel Company Limited generated Rs 338.71 crore of standalone net cash from operating activities in the half year ended September 30, 2026, compared with Rs 173.95 crore a year earlier. Cash and cash equivalents rose to Rs 321.33 crore from Rs 180.41 crore at March 31, 2026, while total borrowings declined to Rs 388.52 crore.
Know Sunflag Iron & Steel Company inside out
Results, valuation, peers and who's buying, in one view.
How much operating cash did Sunflag generate in the first half?
Sunflag generated Rs 338.71 crore in net cash from standalone operating activities in the half year ended September 30, 2026, an increase of Rs 164.76 crore from Rs 173.95 crore in the corresponding 2025 period. Cash generated from operations was Rs 368.85 crore before net income-tax payments of Rs 31.14 crore.
Operating profit before working-capital changes increased to Rs 243.56 crore from Rs 227.70 crore. The rise in cash generated from operations was larger because changes in operating liabilities provided Rs 210.71 crore, compared with a Rs 5.17 crore outflow a year earlier, despite cash being used by inventories and receivables.
Inventories used Rs 21.43 crore and trade receivables used Rs 67.37 crore during the 2026 half year. In the prior-year period, inventories used Rs 21.21 crore while receivables released Rs 1.53 crore, showing that the year-on-year increase in operating cash was substantially influenced by the movement in operating liabilities.
What happened to Sunflag's cash balance by September 2026?
Sunflag's standalone cash and cash equivalents stood at Rs 321.33 crore at September 30, 2026, up Rs 140.92 crore from Rs 180.41 crore at March 31, 2026. The closing balance was also above Rs 140.69 crore at September 30, 2025.
The half-year increase reconciles operating cash generation with investment and financing outflows. Sunflag recorded net investing cash outflow of Rs 73.89 crore and net financing cash outflow of Rs 123.90 crore, following the Rs 338.71 crore operating inflow.
Payments for property, plant and equipment, capital work-in-progress and capital advances totalled Rs 90.21 crore, compared with Rs 80.58 crore in the prior-year half. Interest paid was Rs 26.74 crore, while dividends paid were Rs 10.72 crore and lease-liability payments were Rs 4.69 crore.
Did Sunflag reduce borrowings in the first half?
Sunflag reduced standalone borrowings to Rs 388.52 crore at September 30, 2026 from Rs 470.27 crore at March 31, 2026, a decline of Rs 81.75 crore. Non-current borrowings fell to Rs 26.39 crore from Rs 56.82 crore, and current borrowings declined to Rs 362.13 crore from Rs 413.45 crore.
The financing cash-flow statement reports Rs 79.27 crore of long-term borrowing repayments during the six months, with no proceeds from long-term borrowings reported for the 2026 half year. The comparable 2025 period included Rs 22.40 crore of long-term borrowing proceeds and Rs 78.23 crore of repayments.
Finance costs were Rs 28.49 crore in the half year ended September 30, 2026, down from Rs 37.35 crore a year earlier. The filing does not disclose a borrowing target or a future debt-repayment schedule, so the reported figures establish the period-end balance rather than a management forecast.
Got a follow-up? Ask IRIS
What do Sunflag's working-capital movements show?
Sunflag's operating-liability changes generated Rs 210.71 crore of cash in the 2026 half year, compared with a Rs 5.17 crore outflow in the same period of 2025. Trade payables accounted for Rs 190.96 crore of the increase, while other current liabilities contributed Rs 18.99 crore.
At September 30, 2026, trade payables stood at Rs 718.58 crore, compared with Rs 527.23 crore at March 31, 2026. Trade receivables rose to Rs 403.51 crore from Rs 339.33 crore and inventories increased to Rs 997.69 crore from Rs 976.26 crore, explaining the cash use recorded for those operating assets.
Revenue from operations increased to Rs 2,200.85 crore in the six months ended September 30, 2026 from Rs 1,996.22 crore in the prior-year half. Profit before tax rose to Rs 164.27 crore from Rs 140.69 crore, and Sunflag identified Iron & Steel Business as its sole reportable operating segment, with operations mainly within India.
How did investment values affect Sunflag's balance sheet?
Sunflag's standalone investments increased to Rs 11,369.18 crore at September 30, 2026 from Rs 7,695.38 crore at March 31, 2026. The filing says other comprehensive income was mainly on account of a mark-to-market gain on equity shares held in Loyds Metal & Energy Limited.
Other equity rose to Rs 11,928.28 crore from Rs 8,665.19 crore, while total equity increased to Rs 12,108.50 crore from Rs 8,845.41 crore. The half-year other comprehensive income was Rs 3,138.82 crore, which is separate from cash generated by the operating business.
Deferred tax liabilities increased to Rs 1,639.37 crore from Rs 1,108.12 crore over the same period. Total standalone assets reached Rs 15,203.15 crore at September 30, 2026, compared with Rs 11,279.46 crore at March 31, 2026, reflecting both the investment valuation movement and changes in operating assets.
Conclusion
Sunflag's half-year statements show operating cash flow of Rs 338.71 crore, cash and cash equivalents of Rs 321.33 crore, and total borrowings of Rs 388.52 crore at September 30, 2026. The operating cash increase coincided with higher trade payables, while receivables and inventories also rose, making working-capital movements central to the reported cash result.
The filing does not set a borrowing target or future repayment schedule, leaving subsequent financial disclosures to show whether debt reduction and operating cash conversion continue. The unresolved availability of financial information for Madanpur (North) Coal Block Private Limited, which was not consolidated and whose investment is fully impaired, is also disclosed in the consolidated review report.