










Sunil Healthcare Limited Q2 FY27 revenue falls 18% as PAT drops 76%
Key highlights
- Sunil Healthcare reported Q2 FY27 consolidated revenue of ₹19.22 crore, down 18.3% year-on-year.
- Consolidated Q2 FY27 profit after tax fell 76.1% to ₹0.24 crore from ₹1.00 crore.
- Other income of ₹1.19 crore exceeded consolidated pre-tax profit of ₹0.30 crore.
- H1 FY27 consolidated operating cash flow was a ₹4.21 crore outflow versus a ₹13.86 crore inflow a year earlier.
powered by IRIS
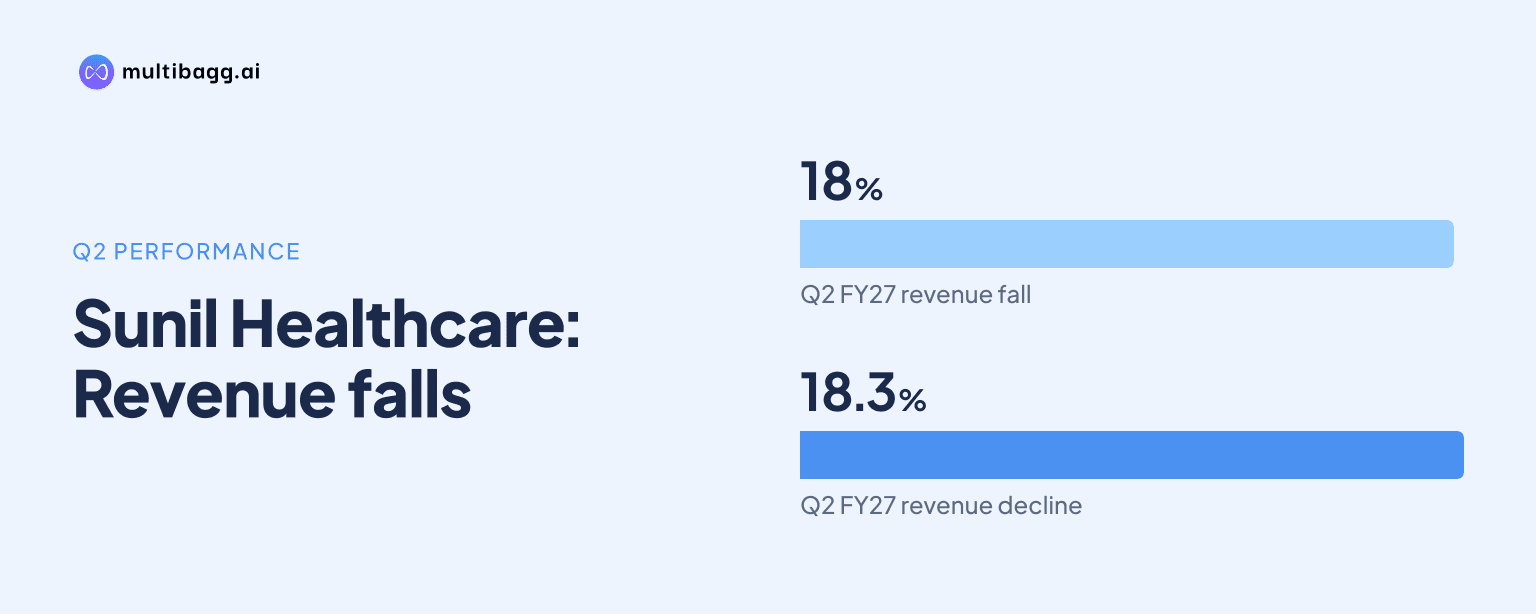
Sunil Healthcare Limited reported consolidated Q2 FY27 revenue from operations of ₹19.22 crore, down 18.3% year-on-year, while profit after tax fell 76.1% to ₹0.24 crore for the quarter ended September 30, 2026. The results show that lower sales and a weaker operating position reduced profitability despite higher other income.
Know Sunil Healthcare inside out
Results, valuation, peers and who's buying, in one view.
What did Sunil Healthcare report for Q2 FY27?
Sunil Healthcare reported consolidated revenue from operations of ₹19.22 crore in Q2 FY27, compared with ₹23.52 crore in Q2 FY26. Revenue was marginally higher than ₹18.99 crore reported in the preceding Q1 FY27, rising 1.3% sequentially, but it remained well below the prior-year quarterly level.
Consolidated profit before tax declined to ₹0.30 crore from ₹1.30 crore a year earlier. Profit after tax fell to ₹0.24 crore from ₹1.00 crore, bringing the PAT margin down to 1.2% from 4.2% in Q2 FY26. Basic earnings per share on the consolidated basis stood at ₹0.23 for the quarter.
The Board of Directors approved the unaudited standalone and consolidated financial results for the quarter and half year ended September 30, 2026, at its meeting on November 13, 2026. The results were accompanied by a limited review report from statutory auditor Singhi & Co.
Why did profitability decline despite lower expenses?
Profitability declined because the fall in revenue was steeper than the reduction in expenses. Consolidated total expenses decreased 11.1% to ₹20.11 crore, but revenue from operations declined by 18.3%. Revenue was ₹0.89 crore below total expenses during the quarter, compared with a ₹0.88 crore surplus a year earlier.
Other expenses fell 27.2% to ₹5.95 crore from ₹8.17 crore. Employee costs reduced to ₹3.06 crore from ₹3.32 crore, while depreciation declined to ₹1.46 crore from ₹1.64 crore. These cost reductions limited, but did not offset, the effect of lower sales on operating performance.
Other income rose to ₹1.19 crore from ₹0.42 crore in Q2 FY26 and exceeded the quarter's consolidated pre-tax profit of ₹0.30 crore. Based on revenue from operations less total expenses, the core business recorded an operating loss of ₹0.89 crore. The reported pre-tax profit was therefore supported by non-operating income rather than by a surplus from revenue from operations after expenses.
How did Sunil Healthcare perform in the first half of FY27?
Sunil Healthcare reported consolidated revenue from operations of ₹38.21 crore for the first half of FY27, down 17.2% from ₹46.16 crore in the corresponding six-month period of FY26. Consolidated half-year profit after tax was ₹0.70 crore, compared with ₹1.90 crore a year earlier.
The standalone half-year numbers showed a similar trend. Standalone revenue from operations was ₹38.21 crore, while standalone profit after tax was ₹0.70 crore against ₹1.08 crore in H1 FY26. Standalone profit before tax fell to ₹0.50 crore from ₹1.51 crore.
Finance costs increased during the half year as borrowings rose. Standalone finance costs were ₹3.22 crore in H1 FY27, compared with ₹2.84 crore a year earlier. Current borrowings increased to ₹46.78 crore as of September 30, 2026, from ₹40.28 crore at March 31, 2026, while non-current borrowings rose to ₹19.38 crore from ₹15.51 crore.
Got a follow-up? Ask IRIS
What does the cash flow and receivables trend show?
Sunil Healthcare recorded a consolidated operating cash outflow of ₹4.21 crore in H1 FY27, compared with an operating cash inflow of ₹13.86 crore in H1 FY26. The reversal in cash generation coincided with an increase in trade receivables during the period.
On the consolidated balance sheet, trade receivables increased to ₹51.64 crore as of September 30, 2026, from ₹45.13 crore at March 31, 2026. The standalone receivables figure rose to ₹50.18 crore from ₹43.69 crore over the same period. Higher receivables mean a larger share of reported sales remained unpaid at the reporting date.
Other comprehensive loss narrowed to ₹0.18 crore from ₹0.46 crore in Q2 FY26. As a result, consolidated total comprehensive income stood at ₹0.06 crore, compared with ₹0.53 crore in the previous year's quarter. While the narrower comprehensive loss was favourable, it did not materially change the quarter's lower profitability and cash flow position.
Why do these results matter to investors?
The results matter because Sunil Healthcare's quarterly profit was supported by other income while the business recorded a gap between revenue from operations and total expenses. Revenue improved only 1.3% sequentially from Q1 FY27, whereas the year-on-year decline remained substantial at 18.3%.
Working-capital movement is also relevant because receivables increased while operating cash flow turned negative in the first half. The concurrent rise in current and non-current borrowings, along with higher finance costs, provides further context for the pressure on reported earnings. The company disclosed the figures in its approved unaudited results, but did not provide a detailed operational explanation for the revenue decline in the supplied information.
For investors, the principal reported indicators are the pace of revenue recovery, the relationship between operating expenses and sales, collection of trade receivables, borrowing levels, and the contribution of other income to profit. These measures will indicate whether future profitability is being generated from operations or remains dependent on non-operating income.
Conclusion
Sunil Healthcare's Q2 FY27 results reflected weaker year-on-year revenue, lower margins and a sharp fall in profit after tax. Consolidated revenue declined to ₹19.22 crore and PAT fell to ₹0.24 crore, while other income of ₹1.19 crore supported the reported pre-tax profit despite a shortfall between revenue from operations and total expenses.
The next results will be important for assessing whether revenue improves beyond the modest quarter-on-quarter increase seen in Q2. Investors can also track receivables, operating cash flow, borrowings and finance costs after the first half recorded a ₹4.21 crore operating cash outflow and higher debt balances.