










The Hi-Tech Gears reports zero net debt-to-equity, returns fall
Key highlights
- The Hi-Tech Gears reported net debt-to-equity of 0.00 times in H1 FY27, compared with 0.30 times in FY24.
- Consolidated borrowings fell to Rs 46 crore in H1 FY27 from Rs 194.6 crore in FY24.
- The Hi-Tech Gears’ cash conversion cycle increased to 98 days in FY26 from 74 days in FY24.
- FY26 ROCE was 7.4% and ROE was 4.0%, compared with 28.6% and 24.5% in FY24.
powered by IRIS
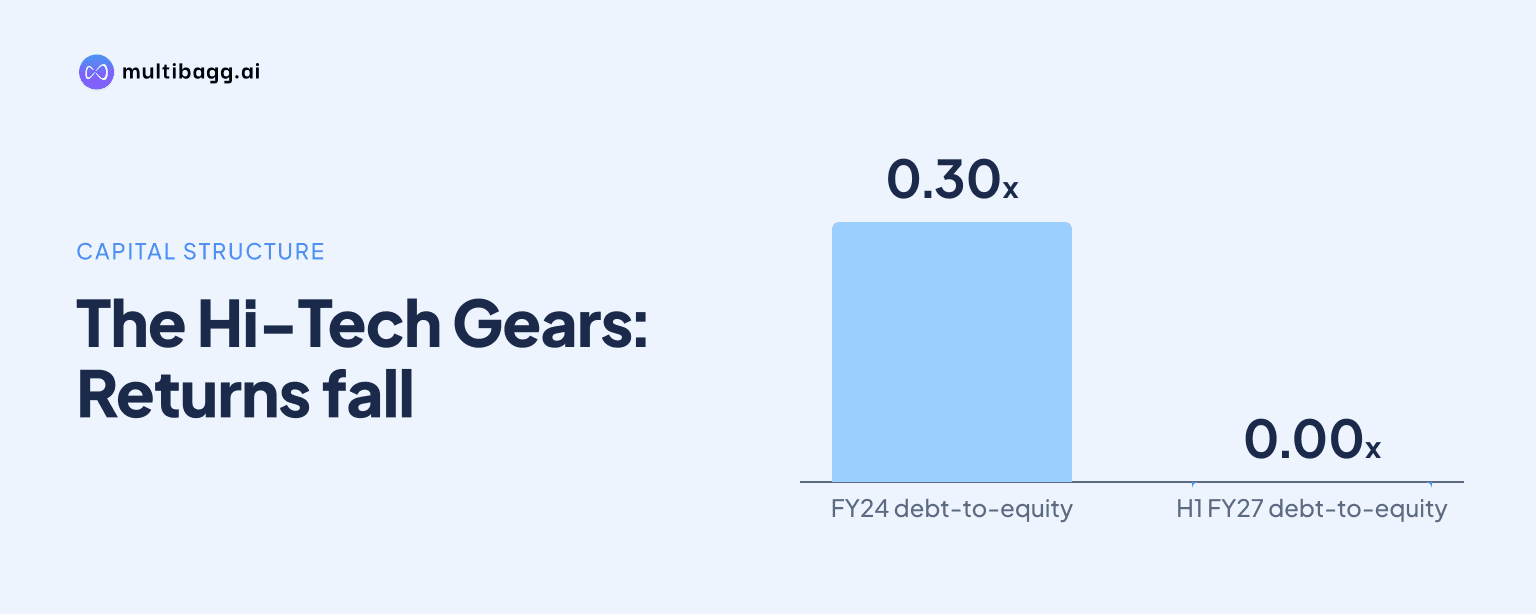
The Hi-Tech Gears Limited reported net debt-to-equity of 0.00 times in H1 FY27, down from 0.30 times in FY24, while its cash conversion cycle reached 98 days in FY26 and return on capital employed fell to 7.4% from 28.6% in FY24. Lower borrowings therefore coincided with longer working-capital conversion and lower reported returns.
Know The Hi-Tech Gears inside out
Results, valuation, peers and who's buying, in one view.
What changed in The Hi-Tech Gears’ balance sheet by H1 FY27?
The Hi-Tech Gears reduced consolidated borrowings to Rs 46 crore in H1 FY27 from Rs 194.6 crore in FY24, while equity rose to Rs 529.8 crore from Rs 466.2 crore. The company’s reported net debt-to-equity ratio consequently declined from 0.30 times in FY24 to 0.09 times in FY25, 0.05 times in FY26 and 0.00 times in H1 FY27.
The reduction was led by current borrowings, which fell to Rs 38.9 crore in H1 FY27 from Rs 141.6 crore in FY24. Non-current borrowings declined to Rs 7.1 crore from Rs 53 crore over the same period. Total assets were Rs 854 crore in H1 FY27, below Rs 908.4 crore in FY24, while equity increased by Rs 63.6 crore.
The Hi-Tech Gears held Rs 45.5 crore of cash, cash equivalents and other bank balances in H1 FY27, comprising Rs 5.6 crore of cash and Rs 39.9 crore of other bank balances. The presentation also reports consolidated lease liabilities of Rs 116.4 crore, including Rs 104.1 crore of non-current lease liabilities. It does not disclose the calculation or components used to derive the net debt-to-equity ratio.
How did standalone borrowings compare with consolidated borrowings?
The Hi-Tech Gears’ standalone accounts also show lower borrowings, with no non-current borrowings reported in either FY26 or H1 FY27. Current borrowings fell to Rs 18.9 crore in H1 FY27 from Rs 85.4 crore in FY24, while standalone equity increased to Rs 506.8 crore from Rs 443.1 crore.
The standalone company had Rs 42.6 crore of cash and bank balances at H1 FY27, consisting of Rs 2.7 crore in cash and cash equivalents and Rs 39.9 crore in other bank balances. In FY26, standalone borrowings were Rs 45.1 crore, all classified as current borrowings, before falling by Rs 26.2 crore by H1 FY27.
Lease liabilities remained separate from borrowings in the standalone balance sheet. Non-current lease liabilities were Rs 46.7 crore and current lease liabilities were Rs 3.8 crore in H1 FY27, totalling Rs 50.5 crore. Standalone investments were Rs 155.3 crore, compared with Rs 155.2 crore in FY26, making them the largest standalone non-current financial asset.
Got a follow-up? Ask IRIS
Why did The Hi-Tech Gears’ cash conversion cycle lengthen?
The Hi-Tech Gears’ cash conversion cycle rose to 98 days in FY26 from 74 days in FY24, an increase of 24 days, despite the decline in reported net debt-to-equity. The measure had already increased to 96 days in FY25, so the cycle lengthened in two successive financial years.
Consolidated inventories increased to Rs 148.9 crore in H1 FY27 from Rs 123.6 crore in FY24, while trade receivables decreased to Rs 170.8 crore from Rs 200.4 crore. The receivables trend was uneven: the balance fell to Rs 153 crore in FY25, rose to Rs 173.2 crore in FY26 and then eased in H1 FY27.
Trade payables stood at Rs 120.7 crore in H1 FY27, above Rs 107.6 crore in FY24 and Rs 101.1 crore in FY26. Current assets increased to Rs 409.6 crore in H1 FY27 from Rs 382.1 crore at FY26, while current liabilities rose to Rs 203.9 crore from Rs 190.1 crore. The presentation gives cash-conversion-cycle data only through FY26, so it does not show whether the 98-day cycle changed in H1 FY27.
The standalone working-capital movements differed during H1 FY27. Inventories increased to Rs 104.5 crore from Rs 100.3 crore in FY26, but trade receivables fell to Rs 116.4 crore from Rs 135.8 crore. Trade payables rose to Rs 94.1 crore from Rs 73.9 crore, although the presentation does not report a standalone cash conversion cycle.
What do The Hi-Tech Gears’ returns and earnings show?
The Hi-Tech Gears’ reported return on capital employed, or ROCE, declined to 7.4% in FY26 from 28.6% in FY24, while return on equity, or ROE, declined to 4.0% from 24.5%. The presentation notes that FY24 net profit, ROCE and ROE benefited from Rs 77.2 crore of one-time income in an overseas subsidiary in Q2 FY24.
The FY26 measures were also below FY25, when ROCE was 13.6% and ROE was 8.3%. Consolidated operational revenue decreased to Rs 908.4 crore in FY26 from Rs 1,106.9 crore in FY24, while earnings before interest, tax, depreciation and amortisation, or EBITDA, declined to Rs 101.1 crore from Rs 149.9 crore.
H1 FY27 showed an improvement in reported margins, without providing an updated ROCE or ROE figure. Consolidated revenue was Rs 522.7 crore and EBITDA was Rs 59.9 crore, producing an EBITDA margin of 11.46%, compared with 11.13% in FY26. Profit after tax was Rs 15.5 crore in H1 FY27, with a 2.97% margin, compared with Rs 21 crore and a 2.30% margin in FY26; the half-year and full-year profit amounts are not directly comparable.
Finance costs fell to Rs 14.8 crore in FY26 from Rs 37.8 crore in FY24, alongside the reduction in borrowings. However, FY26 profit after tax of Rs 21 crore was below Rs 40.4 crore in FY25, and EBITDA margin fell from 14.66% in FY25 to 11.13% in FY26. The source does not provide ROCE or ROE data for H1 FY27.
Conclusion
The Hi-Tech Gears’ reported 0.00-times net debt-to-equity ratio in H1 FY27 reflects borrowings of Rs 46 crore, down from Rs 194.6 crore in FY24, alongside Rs 529.8 crore of equity. This balance-sheet change occurred while the cash conversion cycle lengthened to 98 days in FY26 and reported ROCE and ROE fell to 7.4% and 4.0%, respectively.
The next reported periods will show whether the H1 FY27 EBITDA margin of 11.46% is sustained and whether changes in inventories, receivables and payables alter the 98-day FY26 cash conversion cycle. The presentation does not disclose future targets for net debt-to-equity, ROCE, ROE or the cash conversion cycle, and it does not report an H1 FY27 cash-conversion figure.