










Tuni Textile Mills Q2 FY27 results: Oct 15 board meet
Key highlights
- Tuni Textile Mills will meet on October 15, 2026, to approve unaudited Q2 FY27 results for the quarter ended September 30, 2026.
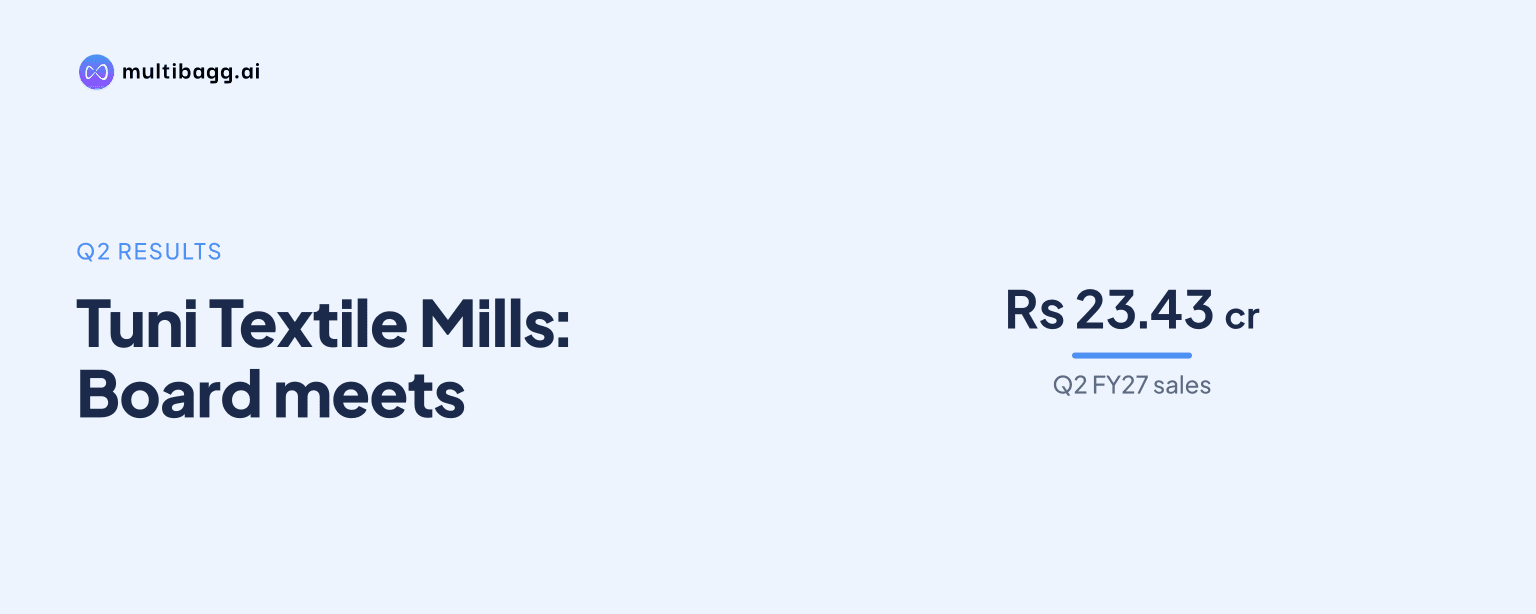
- The company reported June 2026 sales of ₹23.43 crore and net profit of ₹0.27 crore.
- June 2026 sales increased 2.9% year on year, while net profit rose 35.0% year on year.
- Tuni Textile Mills reported a June 2026 operating profit margin of 4.23% and FY 2026-27 order value of ₹30.17 crore.
powered by IRIS
Why this update matters for investors
Tuni Textile Mills Ltd (BSE: 531411) is set for a key disclosure that can reset near-term expectations for the company’s operating and profit trajectory. The company operates in the textiles - weaving segment and is tracked by investors for its quarterly revenue movement and margins. The upcoming board meeting is the formal trigger for the next set of financial numbers. For smaller listed textile companies, periodic results often carry incremental information on demand conditions, cost pressures, and working-capital intensity.
Know Tuni Textile Mills inside out
Results, valuation, peers and who's buying, in one view.
Tuni Textile Mills’ last reported quarter was ended June 2026, when it posted sales of ₹23.43 crore and a net profit of ₹0.27 crore. The same update also flagged year-on-year growth in both revenue and profit for that quarter. Against this backdrop, the September 2026 quarter announcement becomes the next checkpoint for consistency in performance.
Board meeting on Oct 15, 2026: what the filing says
Tuni Textile Mills Limited will hold a board meeting on Thursday, October 15, 2026. The stated purpose is to approve the unaudited financial results for the quarter ended September 30, 2026 for the financial year ending March 31, 2027. The notice references compliance with Regulation 29 of the SEBI (LODR) Regulations, 2015.
The same set of disclosures also describes the event as consideration and approval of un-audited financial results for Q2 FY27. Investors typically treat such board meetings as the anchor date for result publication, after which exchanges and market participants update models and peer comparisons.
Latest reported quarter: June 2026 snapshot
For the quarter ended June 2026 (often referred to as Q1 FY27), Tuni Textile Mills reported:
- Sales (revenue) of ₹23.43 crore
- Net profit of ₹0.27 crore
In the latest-quarter snapshot shared in the data, the company’s EPS (TTM) is 0.0724, while EPS for the latest quarter is 0.0200. These EPS figures are presented alongside quarterly sales and net income for the latest reported period.
Year-on-year and sequential movement in June 2026
The June 2026 quarter showed a measured improvement in top line and a sharper improvement in profit.
Sales in the June 2026 quarter were ₹23.43 crore, up 2.9% from ₹22.77 crore a year earlier. Net profit for the quarter was ₹0.27 crore, up 35.0% year on year. Separately, the data also states that net profit jumped 35% since the same period last year to ₹0.27 crore in Q1 2026-27.
On a quarter-on-quarter basis, the company is described as having generated a 268.75% jump in net profits compared with the prior three-month period. The update does not provide the prior quarter’s net profit figure in the same line, so investors generally treat the percentage as a directional indicator unless reconciled with the detailed financials.
Profitability indicators: operating profit and OPM trend
Operating performance is often best tracked through operating profit and operating profit margin (OPM), especially in textiles where raw material and energy costs can swing margins.
In the operating profit trend table, Tuni Textile Mills recorded operating profit of ₹0.99 crore in June 2026 with an OPM of 4.23%. In earlier quarters shown in the same trend series, operating profit and margins varied, including operating profit of ₹0.82 crore in June 2025 (OPM 3.60%) and ₹1.40 crore in September 2025 (OPM 4.69%). By December 2025, operating profit is listed at ₹1.12 crore with OPM at 2.51%, indicating margin volatility across quarters.
This context matters for the September 2026 quarter because investors typically look for whether OPM sustains near recent levels or reverts with input cost changes.
Order value trend: FY 2026-27 indicator
The dataset also references an order value trend for FY 2026-27, stating an order value of ₹30.17 crore. While order value is not the same as quarterly revenue recognition, it is frequently used as a directional signal for demand and execution visibility in manufacturing-linked businesses.
Because the number is presented as an annual figure for FY 2026-27, the key investor question is how that order value converts into quarterly sales and whether it supports stable utilisation.
Got a follow-up? Ask IRIS
Growth rates disclosed: sales and operating profit CAGR
The update provides headline growth rates that frame longer-term momentum:
- Sales CAGR: 36% (1 year), 22% (3 year), 24% (5 year), 10% (10 year)
- Operating Profit CAGR: 50% (1 year), 14% (3 year), 25% (5 year), 4% (10 year)
These CAGRs, as presented, point to faster recent growth compared with the longer 10-year base, particularly for operating profit on a one-year basis. However, quarterly outcomes can still vary meaningfully as reflected in OPM movements.
Key numbers at a glance
What to watch in the Sep 2026 quarter result
The September 2026 quarter print will be assessed against three reference points available from the current dataset. First is whether revenue growth improves beyond the 2.9% year-on-year pace seen in the June 2026 quarter. Second is whether net profit holds its year-on-year improvement trend after the 35% growth reported for June 2026. Third is whether operating margin stays near the 4% range suggested by the June 2026 OPM of 4.23%.
Investors also typically compare operating profit movement across the most recent quarters already shown, such as the higher operating profit in September 2025 (₹1.40 crore) and the lower OPM in December 2025 (2.51%). The September 2026 quarter results, once published, will allow a clearer read on whether margin variability is narrowing.
Market impact: how this event can influence tracking and sentiment
A scheduled board meeting for results approval is not, by itself, a change in operations, but it creates a defined window for price discovery and revised expectations. For a textiles - weaving company, quarterly releases can influence how investors interpret demand resilience, cost pass-through, and operational efficiency, especially when margins have shown quarter-to-quarter movement.
The company is explicitly described as “scheduled to report results on 15 Oct 2026,” which means market participants often update watchlists and peer comparisons around that date. Any update that confirms or diverges from the latest disclosed figures of ₹23.43 crore in sales and ₹0.27 crore net profit will likely become the headline reference for subsequent quarters.
Conclusion
Tuni Textile Mills’ board meeting on October 15, 2026 sets the timeline for unaudited results for the quarter ended September 30, 2026 under SEBI LODR requirements. The company enters the result with June 2026 sales of ₹23.43 crore and net profit of ₹0.27 crore, alongside year-on-year growth of 2.9% in sales and 35% in profit for that quarter. The next update will clarify whether operating margins and profitability remain aligned with the recent trend data and how FY 2026-27 order value of ₹30.17 crore translates into quarterly performance.