










Ventura Guaranty Q2 FY27 Results Due After ₹63 Cr Q1 Revenue
Key highlights
- Ventura Guaranty reported ₹63.36 crore sales in Q1 FY27, up 6.91% year-on-year.
- Q1 FY27 net profit was ₹9.16 crore, compared with ₹10.65 crore in Q4 FY26.
- Operating profit margin was 27.13% in June 2026, versus 29.22% in March 2026.
- Total borrowings were reported at ₹1,545 crore as of March 31, 2026.
powered by IRIS
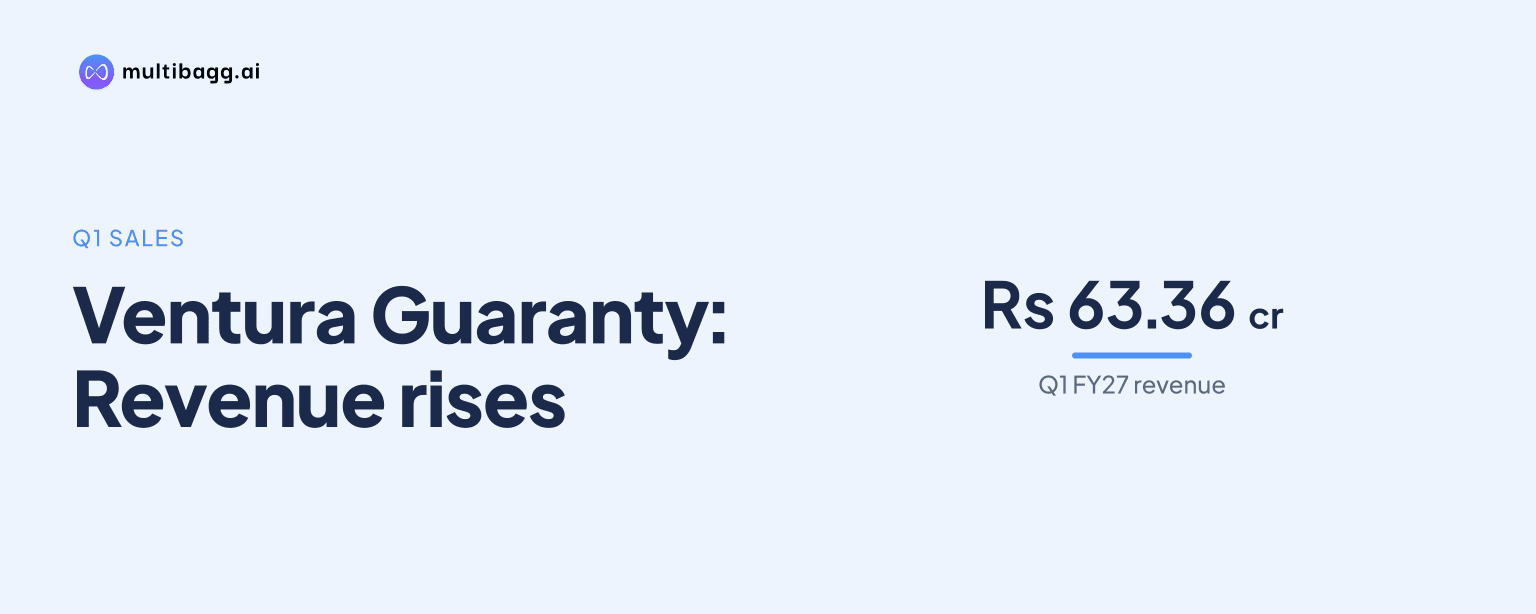
Ventura Guaranty Ltd will consider its Q2 FY27 financial results after reporting consolidated sales of ₹63.36 crore and net profit of ₹9.16 crore in Q1 FY27 ended June 2026. The upcoming disclosure will also cover the half-year ended September 30, 2026, making it relevant for investors tracking revenue, margins, profit and borrowing trends.
Know Ventura Guaranty inside out
Results, valuation, peers and who's buying, in one view.
What has Ventura Guaranty announced for Q2 FY27?
Ventura Guaranty Ltd has announced a board meeting to consider and approve unaudited standalone and consolidated financial results for the quarter and half-year ended September 30, 2026. The material provided does not specify the board-meeting date, but the company has initiated trading-window restrictions for designated persons and their immediate relatives.
The trading window was closed from October 1, 2026 and will remain shut until 48 hours after the results are declared, in line with SEBI regulations. This is a standard compliance step intended to restrict trading by insiders while unpublished price-sensitive information is being considered.
The results are part of a broader Q2 FY27 earnings calendar covering 503 companies on November 12. For Ventura Guaranty, the next release will give the market an updated view of its performance after the June quarter showed stable revenue but a sequential decline in profit from the March 2026 quarter.
How did Ventura Guaranty perform in Q1 FY27?
Ventura Guaranty reported sales of ₹63.36 crore in Q1 FY27, marginally above ₹62.96 crore in Q4 FY26 and 6.91% higher than ₹59.46 crore in Q1 FY26. Net profit was ₹9.16 crore, compared with ₹10.65 crore in the preceding quarter and ₹5.93 crore a year earlier.
The company’s operating profit stood at ₹17.19 crore in the June 2026 quarter, versus ₹18.40 crore in March 2026. Operating profit margin was 27.13%, down from 29.22% sequentially, but above the 22.45% reported in June 2025. Interest expense was ₹3.26 crore, slightly higher than ₹3.19 crore in the March quarter.
Earnings per share for Q1 FY27 were reported at ₹21.23, against ₹25.04 in Q4 FY26 and ₹16.41 in Q1 FY26. The available financial summary described revenue as down 0.16% quarter-on-quarter and net profit as down 13.21% from the March 2026 quarter.
What does the earlier Q2 performance show?
Ventura Guaranty’s previous September-quarter disclosure indicated pressure on quarterly profitability despite broadly steady revenue. The company’s reported Q2 FY26 news update said consolidated net profit fell 24% year-on-year to ₹4.51 crore, while total revenue was ₹59.01 crore, down 0.74% from the prior-year period.
The same update said basic EPS fell to ₹12.60 from ₹16.41. It also reported that H1 FY26 net profit rose 175% to ₹16.34 crore, reflecting a stronger June-quarter contribution. The quarterly financial table rounds September 2025 sales to ₹59.61 crore and net profit to ₹4.68 crore, so figures in disclosures can vary due to rounding and the reporting presentation used.
For the upcoming Q2 FY27 statement, comparisons with both Q1 FY27 and Q2 FY26 will be important. Revenue in the September quarter will show whether the June-quarter level of about ₹63 crore has been maintained, while profit and margin data will indicate whether the sequential moderation seen in Q1 continued.
Got a follow-up? Ask IRIS
Why are borrowings and margins important for investors?
Borrowings and finance costs are material variables for Ventura Guaranty because its FY26 annual-report update recorded a significant rise in total borrowings. Total borrowings stood at ₹1,545 crore as of March 31, 2026, compared with ₹600 crore in the prior year, according to the provided annual-report summary.
The same update placed total credit-risk exposure at ₹4,905.57 lakh, equivalent to ₹49.06 crore. These disclosed figures give context to the company’s quarterly interest expense, which was ₹3.26 crore in June 2026 after ₹3.19 crore in March 2026 and ₹3.85 crore in December 2025.
Margins have improved from the low point reported in March 2025, when operating profit margin was 11.99%. The margin recovered to 29.22% in March 2026 before easing to 27.13% in June 2026. The Q2 FY27 release will provide a current update on operating profitability alongside any changes in expenses, interest costs and tax outgo.
How could the Q2 FY27 results affect market assessment?
The Q2 FY27 results will give shareholders a comparable update on Ventura Guaranty’s sales, operating profitability, net profit and EPS. The June-quarter numbers showed year-on-year improvements in revenue and profit, but sequential declines in operating profit, net profit and EPS from Q4 FY26.
Investors can assess the September-quarter outcome against the company’s Q2 FY26 disclosure, when revenue remained close to ₹59 crore but reported profit declined. The half-year statement will also provide a clearer view of whether the June 2026 profit of ₹9.16 crore was sustained over the first six months of FY27.
The company has also re-appointed its internal auditor for FY27, according to the supplied news summary. Along with the trading-window closure, this indicates that the company is following the disclosure and governance processes associated with its forthcoming financial-results announcement.
Conclusion
Ventura Guaranty enters its Q2 FY27 results announcement after a June quarter in which sales reached ₹63.36 crore, operating profit was ₹17.19 crore and net profit was ₹9.16 crore. The figures were stronger than a year earlier, while sequential profitability was lower than in the March 2026 quarter.
The next disclosure will cover both the September 2026 quarter and the first half of FY27. Investors will watch reported revenue, operating margin, interest expense, net profit and EPS, as well as any update that helps place the company’s higher borrowings and credit-risk exposure in context.