










Viceroy Hotels H1 EBITDA rises 81%, while PBT falls 49%
Key highlights
- Viceroy Hotels’ H1 FY27 total income rose 61.2% to Rs 93.989 crore.
- Viceroy Hotels’ H1 FY27 EBITDA increased 80.9% to Rs 24.676 crore, with margin rising to 26.5%.
- Viceroy Hotels’ H1 FY27 PBT fell 48.9% to Rs 2.39 crore as finance cost reached Rs 11.242 crore.
- Viceroy Hotels ended H1 FY27 with cash and cash equivalents of Rs 110.547 crore after Rs 91.806 crore of financing inflows.
powered by IRIS
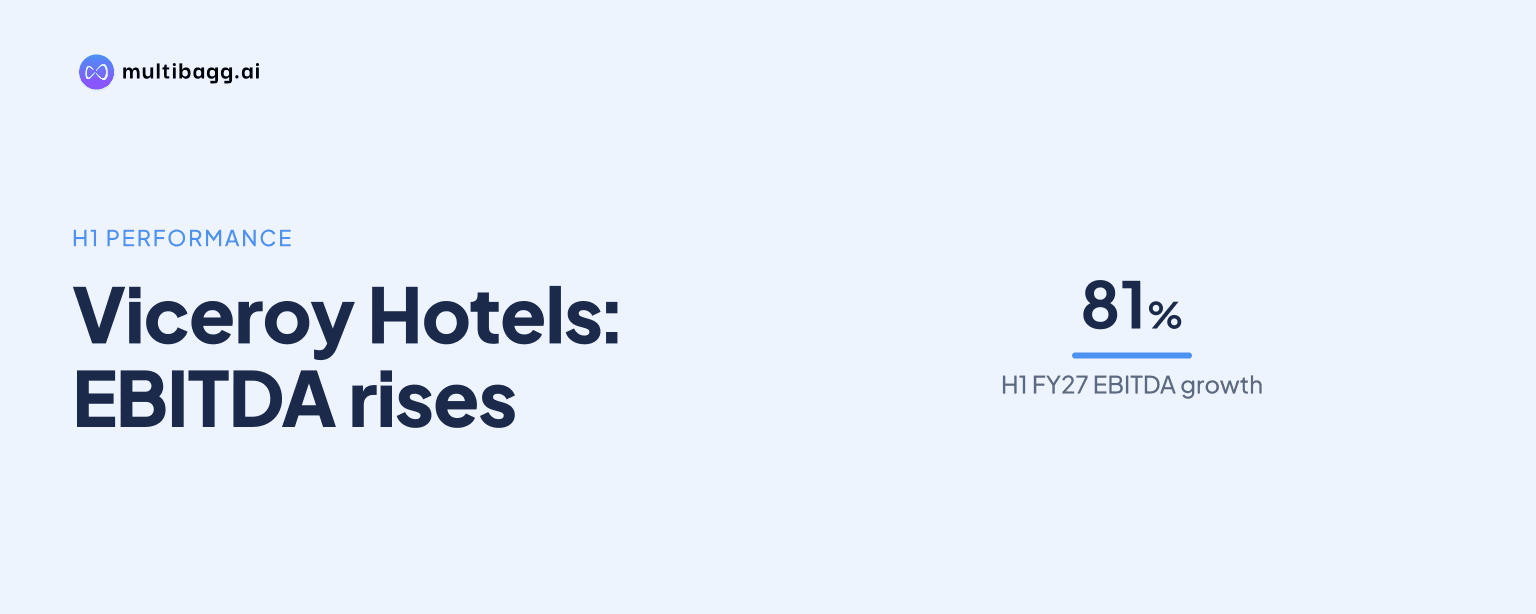
Viceroy Hotels’ H1 FY27 EBITDA rose 81% to Rs 24.676 crore, but profit before tax fell 49% to Rs 2.39 crore as depreciation and amortization reached Rs 11.045 crore and finance cost reached Rs 11.242 crore. Reported profit after tax increased 171% to Rs 3.679 crore after a negative tax line.
Know Viceroy Hotels inside out
Results, valuation, peers and who's buying, in one view.
Why did Viceroy Hotels’ EBITDA increase in H1 FY27?
Viceroy Hotels’ H1 FY27 total income increased 61.2% year on year to Rs 93.989 crore from Rs 58.314 crore, while EBITDA increased 80.9% to Rs 24.676 crore from Rs 13.642 crore. EBITDA margin, calculated by Viceroy Hotels on revenue from operations, rose to 26.5% from 24.3%, a 2.2-percentage-point increase. Total expenditure rose to Rs 69.313 crore from Rs 44.672 crore, an increase of Rs 24.641 crore against a Rs 35.675 crore increase in total income.
The Q2 comparison showed a different margin movement. Q2 FY27 total income rose 53.1% to Rs 48.795 crore and EBITDA increased 46.1% to Rs 12.888 crore, but EBITDA margin declined to 26.7% from 28.6% in Q2 FY26. Viceroy Hotels attributed an EBITDA impact of about Rs 2 crore to the temporary unavailability of banquets during the Marriott Convention Centre renovation and disclosed a one-time Rs 66.23 lakh marketing expense for the Vayu restaurant at Courtyard by Marriott.
Why did Viceroy Hotels’ pre-tax profit decline despite EBITDA growth?
Viceroy Hotels’ profit before tax, or PBT, declined 48.9% to Rs 2.39 crore in H1 FY27 from Rs 4.676 crore in H1 FY26 because depreciation and amortization and finance cost rose by more than EBITDA. Depreciation and amortization increased by Rs 4.181 crore, while finance cost increased by Rs 9.139 crore. The combined rise of Rs 13.32 crore exceeded the Rs 11.034 crore increase in EBITDA.
The pressure was more pronounced in Q2 FY27, when PBT was Rs 1.013 crore, down 76.4% from Rs 4.296 crore in Q2 FY26 and down 26.4% from Rs 1.377 crore in Q1 FY27. The Q2 PBT margin fell to 2.1% from 13.9%, while the H1 PBT margin fell to 2.6% from 8.3%. The figures show that the H1 operating-margin improvement did not carry through to pre-tax profit after depreciation and borrowing-related costs.
How did Viceroy Hotels report higher PAT when PBT fell?
Viceroy Hotels reported profit after tax, or PAT, of Rs 3.679 crore in H1 FY27, up 170.7% from Rs 1.359 crore in H1 FY26, despite a Rs 2.286 crore decline in PBT. The tax line was negative Rs 1.289 crore in H1 FY27, compared with a positive Rs 3.317 crore in H1 FY26. This change in the tax line explains why reported PAT rose while pre-tax earnings declined.
Basic earnings per share increased to Rs 0.55 in H1 FY27 from Rs 0.20 in H1 FY26. In Q2 FY27, PAT was Rs 2.23 crore, down 49.1% from Rs 4.382 crore a year earlier, while the tax line was negative Rs 1.217 crore compared with negative Rs 8.6 lakh in Q2 FY26. The H1 PAT margin rose to 4.0% from 2.4%, moving in the opposite direction from the PBT margin, which fell to 2.6% from 8.3%.
Got a follow-up? Ask IRIS
Did Viceroy Hotels’ cash increase come from operations?
Viceroy Hotels’ closing cash and cash equivalents rose to Rs 110.547 crore at the end of H1 FY27 from Rs 9.705 crore at the end of H1 FY26, with financing activity the largest disclosed contributor to the increase. Cash flow from financing activities was an inflow of Rs 91.806 crore in H1 FY27, against an outflow of Rs 4.948 crore a year earlier. Net cash from operating activities was Rs 18.096 crore, down from Rs 35.30 crore in H1 FY26.
Cash generated from operations declined to Rs 18.481 crore from Rs 35.964 crore because working-capital changes became an outflow of Rs 5.484 crore, compared with an inflow of Rs 24.46 crore in H1 FY26. Investing activities used Rs 18.778 crore, less than the Rs 26.471 crore used a year earlier. With opening cash of Rs 19.423 crore, Viceroy Hotels recorded a net increase in cash and cash equivalents of Rs 91.124 crore during H1 FY27.
What do Viceroy Hotels’ balance sheet and hotel revenues show?
Viceroy Hotels’ total assets increased to Rs 667.669 crore at H1 FY27 from Rs 561.64 crore at FY26, while equity share capital and other equity together reached Rs 375.904 crore from Rs 266.796 crore. Fixed assets increased to Rs 395.962 crore from Rs 346.174 crore, while capital work in progress declined to Rs 15.986 crore from Rs 57.03 crore. Long-term borrowings were Rs 243.775 crore, marginally below Rs 245.395 crore at FY26.
At Courtyard by Marriott and Marriott Hyderabad, H1 rooms revenue grew 39% to Rs 42.077 crore, while food and beverages revenue declined 5% to Rs 22.666 crore because banquets were temporarily unavailable during the Marriott Convention Centre renovation. Marriott Executive Apartments recorded 19% H1 rooms-revenue growth to Rs 17.829 crore and 5% food-and-beverages growth to Rs 6.811 crore. At Marriott Hyderabad, H1 occupancy increased to 73.3% from 65.7%, average daily rate declined to Rs 6,469 from Rs 6,807, and revenue per available room rose to Rs 4,741 from Rs 4,473.
Conclusion
Viceroy Hotels’ H1 FY27 results show a split between operating and pre-tax performance. Total income rose 61.2% and EBITDA rose 80.9%, but PBT fell 48.9% because the Rs 13.32 crore combined increase in depreciation and finance cost exceeded the Rs 11.034 crore EBITDA increase. The 170.7% increase in PAT reflected the movement to a negative Rs 1.289 crore tax line from a positive Rs 3.317 crore tax charge in H1 FY26.
The disclosed item to watch next is the Marriott Convention Centre renovation, which Viceroy Hotels says had about a Rs 2 crore EBITDA impact and restricted banquet availability. Subsequent periods can also show whether food-and-beverages revenue recovers from the H1 FY27 level of Rs 22.666 crore, and whether finance cost changes from Rs 11.242 crore after the Rs 91.806 crore financing inflow recorded in H1 FY27.