










Yatra H1 operating cash flow turns negative on Rs 48.8 crore use
Key highlights
- Yatra used Rs 14.7 crore in operations in H1 FY27 after a Rs 48.8 crore working-capital deployment.
- Yatra reported Rs 218 crore of closing cash and cash equivalents including term deposits at H1 FY27.
- Yatra’s trade receivables increased by Rs 75.2 crore to Rs 610.5 crore at H1 FY27.
- Yatra’s current borrowings increased by Rs 40 crore to Rs 110.4 crore in H1 FY27.
powered by IRIS
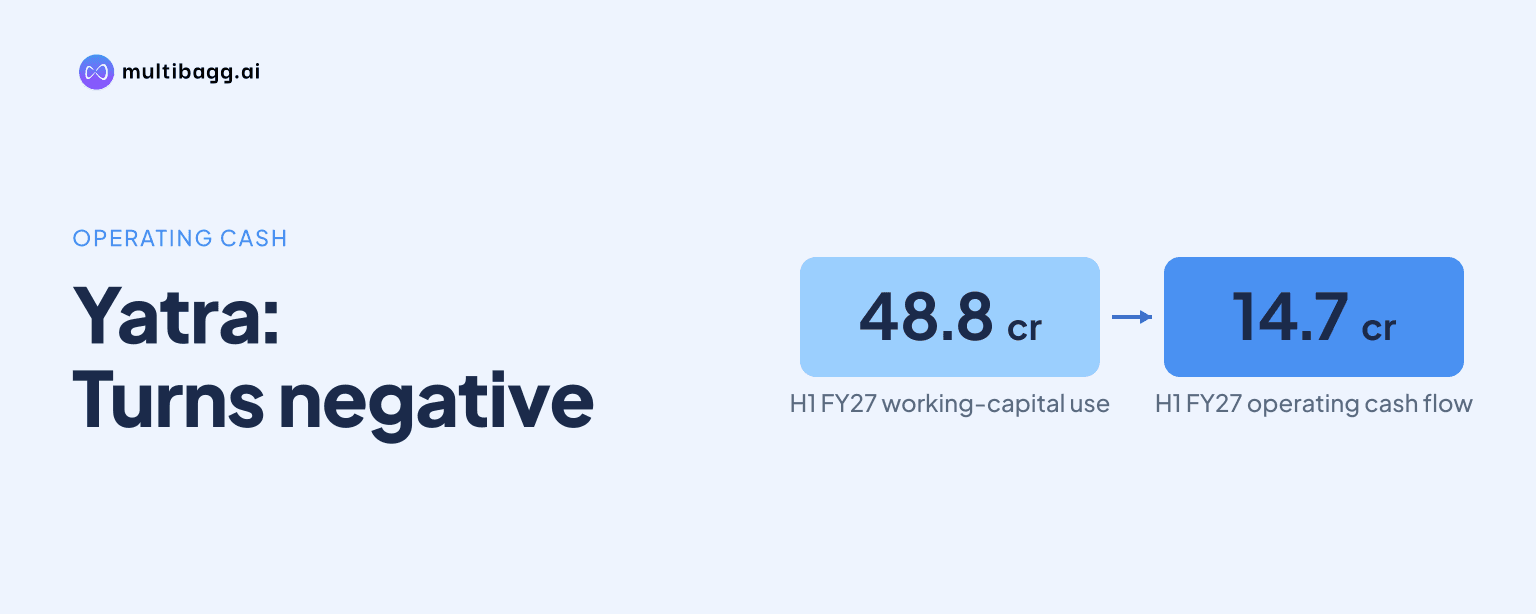
Yatra used Rs 14.7 crore in operations in H1 FY27 because a Rs 48.8 crore working-capital deployment exceeded Rs 34.1 crore of pre-working-capital operating cash flow. The company reported Rs 218 crore of closing cash and cash equivalents including term deposits, while current borrowings increased by Rs 40 crore from FY26.
Know Yatra Online inside out
Results, valuation, peers and who's buying, in one view.
Why did Yatra’s operating cash flow turn negative in H1 FY27?
Yatra’s operating cash flow turned negative because its Rs 34.1 crore cash flow from operations before working capital was more than offset by a Rs 48.8 crore deployment in working capital. Cash used in operations was therefore Rs 14.7 crore in H1 FY27. In FY26, Yatra generated Rs 76.1 crore from operations, supported by Rs 74.5 crore of pre-working-capital cash flow and a Rs 1.6 crore positive working-capital movement.
The pre-working-capital figure in H1 FY27 reflected a Rs 1.1 crore loss before tax and Rs 35.2 crore of non-cash and non-operating adjustments. The cash result differs from the income statement because these adjustments converted the reported pre-tax loss into a positive operating cash measure before the working-capital movement. The presentation does not identify how much of the Rs 48.8 crore use came from individual receivable, payable or other balance-sheet lines.
Working-capital movements have varied across the periods disclosed. Yatra deployed Rs 145.3 crore in FY24 and Rs 40 crore in FY25, before reporting the Rs 1.6 crore positive movement in FY26 and the Rs 48.8 crore deployment in H1 FY27. The company notes that it reclassified term deposits from working capital to investing activities for like-for-like comparison, affecting the FY25 presentation.
How did Yatra’s working-capital balances change in H1 FY27?
Yatra’s trade receivables increased by Rs 75.2 crore to Rs 610.5 crore at H1 FY27 from Rs 535.3 crore at FY26. This increase occurred in the same half year as the Rs 48.8 crore working-capital deployment. However, the presentation does not provide a reconciliation linking the receivables increase directly to the working-capital cash outflow.
Other current-asset categories moved in different directions. Other financial assets increased by Rs 5.9 crore to Rs 150.5 crore, while other current assets fell by Rs 43.7 crore to Rs 135.9 crore. Balance-sheet cash and cash equivalents rose by Rs 0.7 crore to Rs 73.1 crore, and other bank balances declined by Rs 7 crore to Rs 12 crore between FY26 and H1 FY27.
Yatra’s total current liabilities increased by Rs 15.3 crore to Rs 474.2 crore at H1 FY27. Trade payables declined by Rs 27 crore to Rs 187.8 crore, while other current liabilities increased by Rs 10.9 crore to Rs 105 crore. Current provisions rose by Rs 1 crore to Rs 9.6 crore and current lease liabilities rose by Rs 1.1 crore to Rs 9.6 crore.
The balance-sheet movements show that total current assets rose by Rs 31.2 crore to Rs 985 crore, against the Rs 15.3 crore increase in total current liabilities. Receivables became a larger component of current assets, while trade payables declined. The disclosed data support the timing coincidence with the operating cash outflow, but do not establish a specific cause for the full working-capital deployment.
How much liquidity did Yatra report at H1 FY27?
Yatra reported Rs 218 crore of closing cash and cash equivalents including term deposits at H1 FY27, compared with Rs 223 crore at FY26. The historical cash-flow statement separately lists Rs 23.4 crore of closing cash and cash equivalents, Rs 145 crore of term deposits and a Rs 49.6 crore bank overdraft. The presentation labels the combined reported total as closing cash and cash equivalents including term deposits.
The cash-flow statement recorded a Rs 5 crore decline in cash and cash equivalents during H1 FY27. It showed opening cash and cash equivalents of Rs 28.2 crore, a Rs 20 lakh effect of exchange differences and a Rs 49.6 crore bank overdraft. Yatra also reported Rs 12 crore of cash used in investing in other activities, against Rs 44.9 crore used in FY26.
Yatra reported no acquisition-of-business cash outflow in H1 FY27 or FY26. Financing activities provided Rs 21.8 crore in H1 FY27, reversing an Rs 54.4 crore financing outflow in FY26. The presentation does not split the H1 financing inflow between borrowings, lease liabilities or other financing items.
Liquidity measures in the balance sheet were accompanied by Rs 985 crore of current assets and Rs 474.2 crore of current liabilities at H1 FY27. At FY26, current assets were Rs 953.8 crore and current liabilities were Rs 458.9 crore. Total assets increased by Rs 21 crore to Rs 1,357.4 crore, while non-current assets declined by Rs 10.2 crore to Rs 372.4 crore.
Got a follow-up? Ask IRIS
Why did Yatra’s current borrowings rise in H1 FY27?
Yatra’s current borrowings increased by Rs 40 crore to Rs 110.4 crore at H1 FY27 from Rs 70.4 crore at FY26. This increase occurred alongside the Rs 21.8 crore financing cash inflow reported for the half year. The presentation does not say whether the borrowing increase was the sole or primary source of that financing inflow.
Non-current borrowings moved in the opposite direction, declining by Rs 20 lakh to Rs 1 crore. Non-current lease liabilities increased by Rs 7.7 crore to Rs 30.6 crore, while right-of-use assets rose by Rs 9.4 crore to Rs 35.1 crore. Total non-current liabilities increased by Rs 5.8 crore to Rs 53.1 crore.
Yatra’s equity was largely unchanged at Rs 830 crore at H1 FY27, compared with Rs 830.2 crore at FY26. The company reported a net debt-to-equity ratio of negative 0.13 times at H1 FY27, compared with negative 0.18 times at FY26. That metric is presented alongside the higher current borrowings and does not provide a separate calculation of net debt.
The funding changes came during a half year in which cash generated from operations was negative. Cash flow from operations before working capital declined from Rs 74.5 crore in FY26 to Rs 34.1 crore in H1 FY27, while the working-capital movement shifted from a Rs 1.6 crore inflow to a Rs 48.8 crore outflow. These disclosed movements provide context for the simultaneous rise in short-term borrowings.
What operating performance accompanied Yatra’s H1 FY27 cash movement?
Yatra reported revenue from operations of Rs 401.5 crore in H1 FY27, down 28.4% from Rs 560.7 crore in H1 FY26. Revenue less service cost increased 2.8% to Rs 248.2 crore, but operating expenses rose 14.1% to Rs 220.2 crore. Adjusted earnings before interest, tax, depreciation and amortisation, or adjusted EBITDA, fell to Rs 30.1 crore from Rs 50.4 crore.
Adjusted EBITDA margin was 12% in H1 FY27, compared with 20% in H1 FY26. EBITDA was Rs 26.3 crore, down from Rs 49 crore, and EBITDA margin declined to 11% from 20%. Finance cost increased to Rs 10.4 crore from Rs 4.6 crore, while finance income fell to Rs 6.4 crore from Rs 8.6 crore.
Yatra reported a Rs 1.1 crore loss before tax in H1 FY27, compared with a Rs 34 crore profit before tax in H1 FY26. Profit after tax was a Rs 40 lakh loss, compared with a Rs 30.3 crore profit a year earlier. These income-statement results preceded the Rs 34.1 crore operating cash figure before working-capital changes.
Operating metrics showed different margin trends across travel categories. Gross air bookings were Rs 3,358.5 crore in H1 FY27, and air gross margins were Rs 145.5 crore at a 4.33% margin rate. Gross hotel and packages bookings were Rs 793 crore, generating Rs 68.4 crore of gross margins at an 8.63% margin rate. Total gross bookings were Rs 4,266.1 crore for the half year.
Conclusion
Yatra’s H1 FY27 liquidity position combined a Rs 14.7 crore operating cash outflow with Rs 218 crore of reported closing cash and cash equivalents including term deposits. The main disclosed changes were a Rs 48.8 crore working-capital deployment, a Rs 75.2 crore rise in trade receivables and a Rs 40 crore increase in current borrowings, while equity remained close to Rs 830 crore.
The next result should show whether working capital remains a use of cash and how receivables, current borrowings and reported cash including term deposits move from Rs 610.5 crore, Rs 110.4 crore and Rs 218 crore, respectively. Management’s presentation also showed adjusted EBITDA of Rs 30.1 crore and a 12% margin in H1 FY27, versus Rs 50.4 crore and 20% a year earlier, making subsequent cash conversion a disclosed item to monitor.